644
Views
18
CrossRef citations to date
0
Altmetric
Original

Effects of 2-hydroxyoleic acid on the structural properties of biological and model plasma membranes

, , , , , , & show all
Pages 46-57 | Received 10 Apr 2007, Published online: 09 Jul 2009

Figures & data

Figure 1.  Electron micrographs of plasma membranes isolated from SHR control rats (SHR-c), SHR rats treated with 2OHOA (SHR-t) and WKY rats treated with 2OHOA (WKY-t). No differences between control and treated WKY membranes were observed. Several bile canaliculi (BC) and regions of higher opacity (indicated by arrows) are shown.
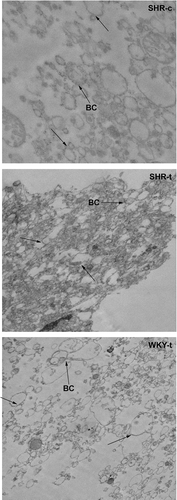
Figure 1.  Electron micrographs of plasma membranes isolated from SHR control rats (SHR-c), SHR rats treated with 2OHOA (SHR-t) and WKY rats treated with 2OHOA (WKY-t). No differences between control and treated WKY membranes were observed. Several bile canaliculi (BC) and regions of higher opacity (indicated by arrows) are shown.

Figure 2.  Effects of 2OHOA treatment on Na+/K+ ATPase and G protein αq/11 levels in liver plasma membranes from SHR and WKY rats. The upper panel shows a representative immunoblot of 3 animals per group (around 10 µg total protein). Columns show the levels of liver plasma membrane Na+/K+ ATPase and G protein αq/11 quantified against standard curves and normalized to the protein content of vehicle-treated rats (taken as 100%). ***p < 0.001 and *p < 0.05 vs. vehicle-treated rats.
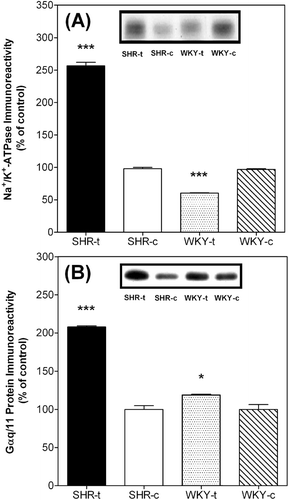
Figure 2.  Effects of 2OHOA treatment on Na+/K+ ATPase and G protein αq/11 levels in liver plasma membranes from SHR and WKY rats. The upper panel shows a representative immunoblot of 3 animals per group (around 10 µg total protein). Columns show the levels of liver plasma membrane Na+/K+ ATPase and G protein αq/11 quantified against standard curves and normalized to the protein content of vehicle-treated rats (taken as 100%). ***p < 0.001 and *p < 0.05 vs. vehicle-treated rats.

Table I.  Effect of 2-hydroxyoleic acid (2OHOA) treatment on systolic blood pressure in spontaneously hypertensive rats (SHR) and Wistar Kyoto (WKY) rats.

Table II.  Lipid composition of liver plasma membrane from SHR and WKY rats treated with 2-hydroxyoleic acid or vehicle.

Table III.  Fatty acid composition of liver plasma membrane from SHR and WKY rats treated with 2-hydroxyoleic acid or vehicle.

Figure 3.  Temperature dependency of the polarity of the DPH probe in reconstituted membranes with total lipid extract from SHR-c (□), SHR-t (▪), WKY-c (○) and WKY-t (•) liver plasma membranes. Fluorescence polarization data are mean values from three independent experiments.
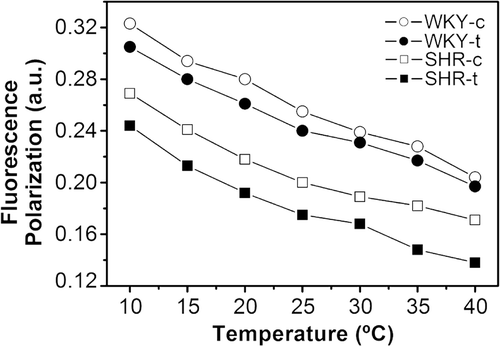
Figure 3.  Temperature dependency of the polarity of the DPH probe in reconstituted membranes with total lipid extract from SHR-c (□), SHR-t (▪), WKY-c (○) and WKY-t (•) liver plasma membranes. Fluorescence polarization data are mean values from three independent experiments.

Figure 4.  Sequence of X-ray diffraction scattering patterns from reconstituted membranes of total lipid extracts from SHR-c (A, F), SHR-t (B, G), SHR-t plus extra added 2OHOA (C, H), WKY-c (D, I) and WKY-t liver plasma membranes (E, J). The sequence of patterns were acquired in kinetic conditions (A–E) with a scan rate of 1°C/min and quasi-equilibrium conditions (F–J) after equilibrating the sample for 15 min at each temperature. Successive diffraction patterns were collected for 15 s each min. The HII phase was identified by 3–4 diffraction peaks indicated (panels F–J). The Lα phase was identified by the first order reflection peak on the SAXS and the absence of peak on the WAXS region.
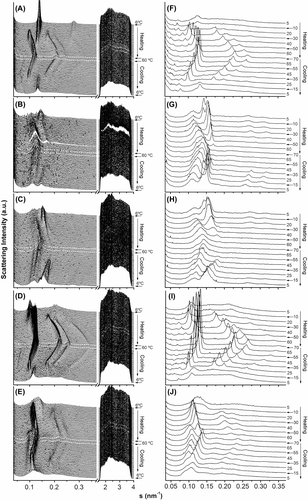
Figure 4.  Sequence of X-ray diffraction scattering patterns from reconstituted membranes of total lipid extracts from SHR-c (A, F), SHR-t (B, G), SHR-t plus extra added 2OHOA (C, H), WKY-c (D, I) and WKY-t liver plasma membranes (E, J). The sequence of patterns were acquired in kinetic conditions (A–E) with a scan rate of 1°C/min and quasi-equilibrium conditions (F–J) after equilibrating the sample for 15 min at each temperature. Successive diffraction patterns were collected for 15 s each min. The HII phase was identified by 3–4 diffraction peaks indicated (panels F–J). The Lα phase was identified by the first order reflection peak on the SAXS and the absence of peak on the WAXS region.

Figure 5.  Dependency of the repeat distance with temperature for the reconstituted membranes from total lipid extract from SHR-c (□), SHR-t (▪), SHR-t plus extra added 2OHOA (♦), WKY-c (○) and WKY-t (•) liver plasma membranes. Phases represented are Lα (dotted lines) and HII (continuous lines). Non-identified phases have been omitted. The heating sequence is only shown.
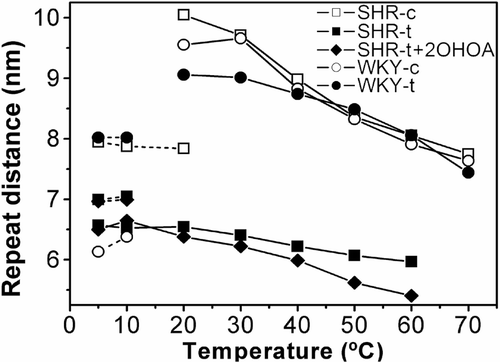
Figure 5.  Dependency of the repeat distance with temperature for the reconstituted membranes from total lipid extract from SHR-c (□), SHR-t (▪), SHR-t plus extra added 2OHOA (♦), WKY-c (○) and WKY-t (•) liver plasma membranes. Phases represented are Lα (dotted lines) and HII (continuous lines). Non-identified phases have been omitted. The heating sequence is only shown.

Reprints and Corporate Permissions

Please note: Selecting permissions does not provide access to the full text of the article, please see our help page How do I view content?

To request a reprint or corporate permissions for this article, please click on the relevant link below:

Academic Permissions

Please note: Selecting permissions does not provide access to the full text of the article, please see our help page How do I view content?

Obtain permissions instantly via Rightslink by clicking on the button below:

If you are unable to obtain permissions via Rightslink, please complete and submit this Permissions form. For more information, please visit our Permissions help page.