897
Views
26
CrossRef citations to date
0
Altmetric
Original

Aminopeptidase N (APN)/CD13-dependent CXCR4 downregulation is associated with diminished cell migration, proliferation and invasion

, , &
Pages 72-82 | Received 20 Nov 2006, Published online: 09 Jul 2009

Figures & data

Figure 1.  APN expression patterns of representative wt and mutant APN transfectants and respective controls. (A) Determination of the APN mRNA expression. mRNA of cell clones was quantified by real time quantitative RT-PCR (each in triplicate experiments) as described in Materials and methods. The results are expressed as relative APN mRNA expression. HEK293 parental cells are set to 1. (B) APN protein expression in APN transfectants. Equal amounts of proteins were resolved by SDS-PAGE and analyzed by Western blot using APN- and GFP-specific antibodies. Staining of the Western blot with an anti-ß-actin mAb served as loading control. (C) Cell surface enzyme activity of APN transfectants. The enzyme activity of HEK293 cells expressing different APN forms was determined by Ala-pNA cleavage as described in Materials and methods. Results are expressed as µmole×min−1×10⁻⁶ cells.
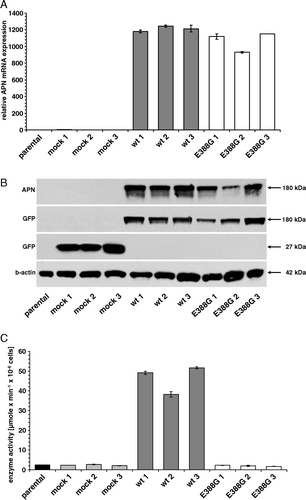
Figure 1.  APN expression patterns of representative wt and mutant APN transfectants and respective controls. (A) Determination of the APN mRNA expression. mRNA of cell clones was quantified by real time quantitative RT-PCR (each in triplicate experiments) as described in Materials and methods. The results are expressed as relative APN mRNA expression. HEK293 parental cells are set to 1. (B) APN protein expression in APN transfectants. Equal amounts of proteins were resolved by SDS-PAGE and analyzed by Western blot using APN- and GFP-specific antibodies. Staining of the Western blot with an anti-ß-actin mAb served as loading control. (C) Cell surface enzyme activity of APN transfectants. The enzyme activity of HEK293 cells expressing different APN forms was determined by Ala-pNA cleavage as described in Materials and methods. Results are expressed as µmole×min−1×10⁻⁶ cells.

Table I.  APN cell surface expression and the enzymatic activity of parental HEK293 cells and transfectants as well as cell extracts.

Figure 2.  Cell growth and migration are dependent on APN enzyme activity. (A) Cell proliferation of APN transfectants. Proliferation was measured using a XTT-based colorimetric assay (absorbance at 492 nm vs. 630 nm in time-dependence). One out of four representative experiments is shown. (B) Decreased migration properties of wt-APN transfected cells. Cell migration of APN transfectants and respective controls was assessed in transwell diffusion chambers. After 22 h of chemotaxis to collagen type I, total migrated cells were quantified by a luciferase-based system. Values are given as percentage of migrated cells compared to the number of cells employed. Data are pooled from three independent experiments. (C) Soft agar colony formation. Anchorage-independent growth of APN transfectants was determined in soft agar. Double layer agar cultures in 60-mm petri-dishes were established as described in Materials and methods. 2×10⁴ cells were cultured in humidity at 37°C for 18 days. After staining of viable cells with iodo-nitrotetrazoliumchloride overnight, colonies were microscopically counted. A representative staining pattern of APN transfectants is shown.
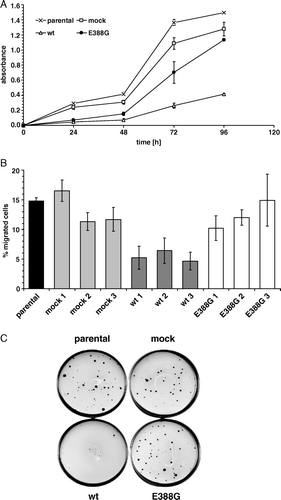
Figure 2.  Cell growth and migration are dependent on APN enzyme activity. (A) Cell proliferation of APN transfectants. Proliferation was measured using a XTT-based colorimetric assay (absorbance at 492 nm vs. 630 nm in time-dependence). One out of four representative experiments is shown. (B) Decreased migration properties of wt-APN transfected cells. Cell migration of APN transfectants and respective controls was assessed in transwell diffusion chambers. After 22 h of chemotaxis to collagen type I, total migrated cells were quantified by a luciferase-based system. Values are given as percentage of migrated cells compared to the number of cells employed. Data are pooled from three independent experiments. (C) Soft agar colony formation. Anchorage-independent growth of APN transfectants was determined in soft agar. Double layer agar cultures in 60-mm petri-dishes were established as described in Materials and methods. 2×10⁴ cells were cultured in humidity at 37°C for 18 days. After staining of viable cells with iodo-nitrotetrazoliumchloride overnight, colonies were microscopically counted. A representative staining pattern of APN transfectants is shown.

Table II.  Relative mRNA and cell surface expression of different chemokine receptors in HEK293 cells and transfectants

Supplementary Table I. Primer sequences used for real time quantitative RT-PCR and antibodies for flow cytometry.

Supplementary Table II. Primer sequences used for real time quantitative RT-PCR and antibodies for flow cytometry.

Figure 3.  The major expressed chemokine receptor CXCR4 is downregulated in wt-APN transfectants on mRNA and protein levels. (A) mRNA expression levels of different chemokine receptors in HEK293 cells using real time quantitative RT-PCR analysis. Values are given as X-fold mRNA expression with CXCR1 expression set to 1. (B) mRNA from parental HEK293 cells as well as transfectants was subjected to real time quantitative RT-PCR analysis using CXCR4-specific primers. Gene expression levels were normalized to HPRT1 expression and then displayed as X-fold mRNA expression with HEK293 parental cells set to 1. (C) CXCR4 cell surface expression of controls and APN transfectants. Cells were detached and directly stained with PE-coupled anti-CXCR4-specific mAb. After fixation with paraformaldehyde PE-fluorescence intensity of cells was determined by flow cytometry. Values are expressed as mean specific fluorescence intensity (MFI) of FL2. Results are shown as average of three independent experiments.
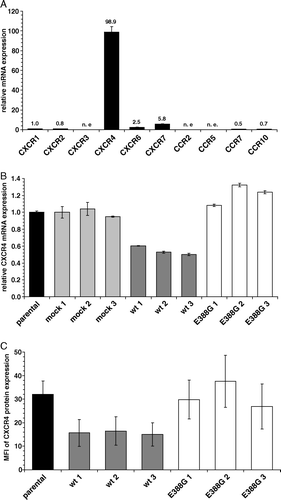
Figure 3.  The major expressed chemokine receptor CXCR4 is downregulated in wt-APN transfectants on mRNA and protein levels. (A) mRNA expression levels of different chemokine receptors in HEK293 cells using real time quantitative RT-PCR analysis. Values are given as X-fold mRNA expression with CXCR1 expression set to 1. (B) mRNA from parental HEK293 cells as well as transfectants was subjected to real time quantitative RT-PCR analysis using CXCR4-specific primers. Gene expression levels were normalized to HPRT1 expression and then displayed as X-fold mRNA expression with HEK293 parental cells set to 1. (C) CXCR4 cell surface expression of controls and APN transfectants. Cells were detached and directly stained with PE-coupled anti-CXCR4-specific mAb. After fixation with paraformaldehyde PE-fluorescence intensity of cells was determined by flow cytometry. Values are expressed as mean specific fluorescence intensity (MFI) of FL2. Results are shown as average of three independent experiments.

Figure 4.  HEK293 cells migrate specifically to SDF-1α and APN overexpression inhibits this migration capability. (A) HEK293 cells migrate to recombinant SDF-1α in a dose-dependent manner. Different concentrations of recombinant SDF-1α were used as a chemoattractant in the migration assay as described in Materials and methods. Values are given as percentage of migrated cells compared to the total number of cells employed. (B) SDF-1α-induced migration of HEK293 cells can be blocked by the CXCR4-specific inhibitor AMD3100. Different concentrations of AMD3100 were used in combination with 50 nM SDF-1α in migration assay as described above. (C) Wt-APN expression blocks SDF-1α-induced migration. Wt-APN and APN-388G transfectants as well as vector control cells were analyzed for CXCR4-specific migration using 50 nM SDF-1α in presence or absence of 25 µM AMD3100.
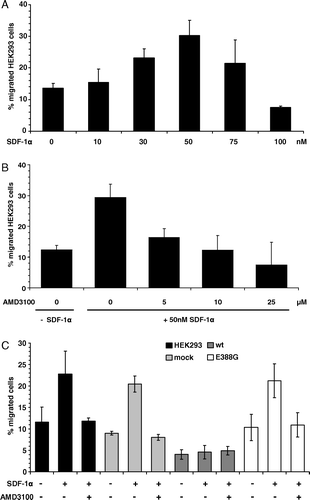
Figure 4.  HEK293 cells migrate specifically to SDF-1α and APN overexpression inhibits this migration capability. (A) HEK293 cells migrate to recombinant SDF-1α in a dose-dependent manner. Different concentrations of recombinant SDF-1α were used as a chemoattractant in the migration assay as described in Materials and methods. Values are given as percentage of migrated cells compared to the total number of cells employed. (B) SDF-1α-induced migration of HEK293 cells can be blocked by the CXCR4-specific inhibitor AMD3100. Different concentrations of AMD3100 were used in combination with 50 nM SDF-1α in migration assay as described above. (C) Wt-APN expression blocks SDF-1α-induced migration. Wt-APN and APN-388G transfectants as well as vector control cells were analyzed for CXCR4-specific migration using 50 nM SDF-1α in presence or absence of 25 µM AMD3100.

Supplementary Figure 1.  All amino acid substitutions in the enzymatic active site of APN cause a complete loss of APN-specific activity. (A) Schematic illustration of the initial step of peptide cleavage by APN. Histidines H387 and H391 as well as glutamate E410 complex the zinc ion. E354 is involved in the polarization of the amino terminus of peptides, whereas E388 polarizes a water molecule, which attacks the carboxyl group of peptide bond. (B) Kinetic plot of cell extracts of APN-WT and APN-E388G expressing transfectants using Ala-pNA as substrate. Replicate determination for APN-WT (▴) and E388G (○) using different substrate concentration and enzyme activities are directly fitted to Michaelis-Menten curves. The curve of the APN-E388G transfectants is characteristic for the other variants exhibiting loss of enzymatic activity.
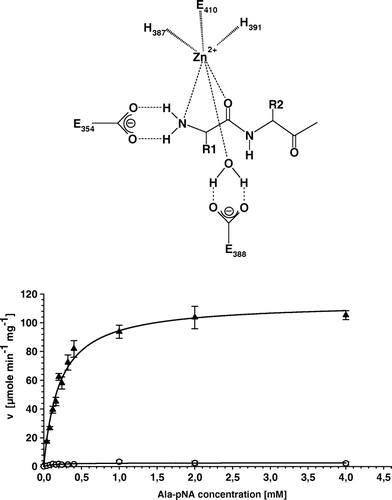
Supplementary Figure 1.  All amino acid substitutions in the enzymatic active site of APN cause a complete loss of APN-specific activity. (A) Schematic illustration of the initial step of peptide cleavage by APN. Histidines H387 and H391 as well as glutamate E410 complex the zinc ion. E354 is involved in the polarization of the amino terminus of peptides, whereas E388 polarizes a water molecule, which attacks the carboxyl group of peptide bond. (B) Kinetic plot of cell extracts of APN-WT and APN-E388G expressing transfectants using Ala-pNA as substrate. Replicate determination for APN-WT (▴) and E388G (○) using different substrate concentration and enzyme activities are directly fitted to Michaelis-Menten curves. The curve of the APN-E388G transfectants is characteristic for the other variants exhibiting loss of enzymatic activity.

Reprints and Corporate Permissions

Please note: Selecting permissions does not provide access to the full text of the article, please see our help page How do I view content?

To request a reprint or corporate permissions for this article, please click on the relevant link below:

Academic Permissions

Please note: Selecting permissions does not provide access to the full text of the article, please see our help page How do I view content?

Obtain permissions instantly via Rightslink by clicking on the button below:

If you are unable to obtain permissions via Rightslink, please complete and submit this Permissions form. For more information, please visit our Permissions help page.