Figures & data
Figure 1. Western blot analysis of (i) the NCAM profile of control neural cells; all three isoforms of NCAM (-120, -140, -180) are expressed by neural cells; (ii) PIPLC-treated neural cells; 70% of NCAM-120 is removed. (iii) EndoN-treated cells; embryonic neural cells are highly sialylated (PSA was detected at 250 kDa), while enzymatic digestion resulted in complete removal of PSA from NCAM. (iv) PCR analysis at 48 h post transfection of NCAM siRNA transfected cells (lane 1), cells transfected with scrambled oligos (lane 2) and untreated cells (lane 3) (n=3). β-actin was used for normalization. Data are representative of 2 or 3 independent experiments.
Table I. Summary of the percentages of the different NCAM isoforms measured by densitometric analysis for control and PIPLC-treated cells.
Table II. Summary of the NCAM-related treatments together with their effect on NCAM and PSA-NCAM.
Figure 2. (a) Neural cell aggregate levitated in the trap for 20 s. Cell aggregate morphology was open with a number of voids. Scale bar is 60 µm. (b) Zoom-in image of part of an aggregate levitated in the trap for 3 min; the initial signs of an extended perimeter contact are shown (arrows). Scale bar is 20 µm.
Figure 3. (i) Representative micrographs captured from different fields of view of the distribution of F-actin (a, b, c) and NCAM (d, e, f) in neural cells levitated in the trap for 1 (a, d), 7 (b, e) and 30 min (c, f). At 1 min (a) cells showed a small and thin interfacial actin (arrows), while at 7 min (b) the length and thickness of the interface has increased (arrows); at 30min (c) strong actin accumulation at the cell- cell interface is shown (arrows). NCAM was present at the cell interface from the initial minutes of cell-cell contact (1 min, d, arrows) with progressive accumulation at the interface over the ensuing 29 min (e-f, arrows).Scale bar is 50 µm. (ii) Close-up representative micrographs showing the distribution of PSA-NCAM in cells levitated in the trap for 1 (a) and 30 min (b). PSA is initially (1 min, a) located pericellularly in a spot-like pattern (arrow), while after 29 min (b) a continuous PSA-NCAM interface is observed (arrow). Scale bar is 15 µm. This Figure is reproduced in colour in Molecular Membrane Biology online.
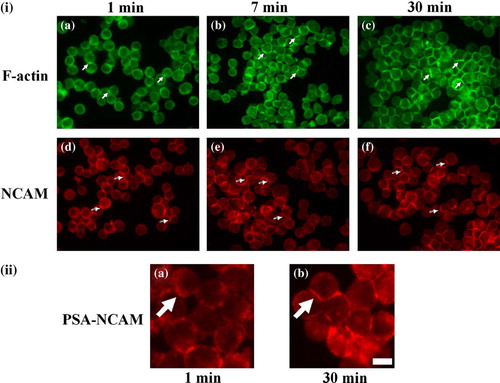
Figure 4. Representative micrographs of the distribution of F-actin (i–iv a), PSA-NCAM (i b) and NCAM (ii–iv b) in cells pre-treated with (i) 20 U/ml EndoN, (ii, iii) 175 ng of NCAM siRNA and (iv) 0.2 mg/ml of peptide. (i) EndoN pre-treated cells showed an F-actin distribution at 7 min (a) comparable to control cells at 30 min (ic), while no PSA-NCAM (b) was detected. (ii) Little F-actin could be detected at the cell-cell interface (a) in NCAM siRNA transfected cells levitated in the trap for 30 min; (b) NCAM -/- staining in these cells; (c) superimposed image of F-actin with NCAM. Attention is drawn to a set of four NCAM -/- cells present in this field of view embedded in a red rectangle and highlighted in (iii). (iii) F-actin (a) in NCAM knockdown cells was diffusely localized in the cells; a short and thin interface is also shown. Very little or no NCAM (b) could be detected; (c) superimposed image of F-actin with NCAM. (iv) In peptide pre-treated cells, 2.76-fold less F-actin (a) is concentrated at the cell-cell interface over 30 min; NCAM (b) was to a great extent localized pericellularly (block arrow), whereas interfacial NCAM staining appeared quite punctate (dotted arrow); (c) superimposed image. Scale bar in (i, ii, iv) is 100 µm and in (iii) 10 µm. This Figure is reproduced in colour in Molecular Membrane Biology online.
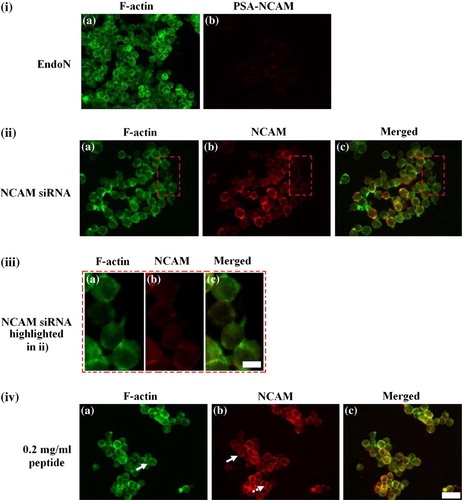
Figure 5. Measurements of the integral intensity of AlexaFluor 488-Phalloidin staining at the cell-cell interface of 20 randomly selected pairs of cells (n=20) pre-subjected to different treatments. Measurements were performed in aggregates of cells being in contact in the trap for 1, 3, 7, 10 and 30 min. Error bars represent one standard error of the mean.
Figure 6. Measurements of (i) the integral intensity of AlexaFluor 488-Phalloidin staining at the cell-cell interface of 20 randomly selected pairs of cells (n=20), and (ii) of the angle θ formed by paired cells pre-subjected to 0–5 mg/ml of NCAM-blocking peptide. Error bars represent one standard error of the mean.
Figure 7. Measurements of the angle θ of the cell-cell interface ‘chord’ of cells subjected to different treatments over time (min). Measurements were conducted in 20 randomly selected pairs of cells (n=20); error bars represent the standard deviation.
Table III. Summary of the different rates of spreading ‘b’ extracted from Origin 7 for the different NCAM-related treatments applied in this study, together with the values of the asymptotic extent of spreading ‘α’.±represents the estimated standard error of ‘α’ and ‘b’ after 10 iterations as generated in Origin 7.
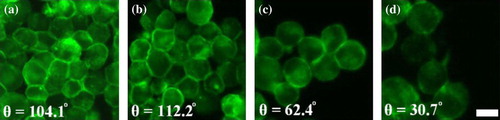
Figure 8. Zoom-in typical micrographs of sets of cells stained with AlexaFluor 488-Phalloidin after 30 min in contact in the trap; (a) control, (b) EndoN, (c) peptide and (d) siRNA NCAM pre-treated cells. The angle θ is measured from immunofluorescence F-actin images, as F-actin reorganization is a marker of the extent of perimeter contact increase. Scale bar is 10 µm. This Figure is reproduced in colour in Molecular Membrane Biology online.
Supplementary Figure 1. (i) Schematic of the temporal progression of cells in a ?/2 ultrasound trap, showing (a) particles homogeneously distributed at time zero, (b) cells already in the pressure node plane within 1 s and (c) subsequent concentration of the cells in a single aggregate. (ii) Experimental assembly: The resonator outer diameter is 25 mm. Its main components were a 1.5 MHz disc transducer that was glue-attached to a steel acoustic coupling layer, a sample volume and glass acoustic reflector. The assembly is placed on the top of an epi-fluorescence microscope's stage. (iii) Schematic diagram of an interacting cell doublet; L is the length of the F-actin staining region or ‘chord’ (drawn here as a straight line), R is the radius of the cells and ? is the angle subtended by the ‘chord’ at the centre of the cell [33].
![Supplementary Figure 1. (i) Schematic of the temporal progression of cells in a ?/2 ultrasound trap, showing (a) particles homogeneously distributed at time zero, (b) cells already in the pressure node plane within 1 s and (c) subsequent concentration of the cells in a single aggregate. (ii) Experimental assembly: The resonator outer diameter is 25 mm. Its main components were a 1.5 MHz disc transducer that was glue-attached to a steel acoustic coupling layer, a sample volume and glass acoustic reflector. The assembly is placed on the top of an epi-fluorescence microscope's stage. (iii) Schematic diagram of an interacting cell doublet; L is the length of the F-actin staining region or ‘chord’ (drawn here as a straight line), R is the radius of the cells and ? is the angle subtended by the ‘chord’ at the centre of the cell [33].](/cms/asset/4f33a8d5-bedb-4343-b04f-83c793f5d389/imbc_a_261687_f0009_b.jpg)