Figures & data
Figure 1. Fusion activity (A) and amino acid sequence (B) of two peptides fragments of dengue E glycoprotein corresponding to the putative fusion peptide alone (amino acids between 98 and 112, underlined in B) or with part of two flanking β-strands, named DEN Fpep (amino acids between 88 and 123). DEN Fpep arrangement as it appears in the structure of E glycoprotein (C) solved by Modis et al. Citation[5]. Hydrophobic (blue), non-charged polar (green) and charged polar (red) residues are represented. This figure is reproduced in colour in Molecular Membrane Biology online.
![Figure 1. Fusion activity (A) and amino acid sequence (B) of two peptides fragments of dengue E glycoprotein corresponding to the putative fusion peptide alone (amino acids between 98 and 112, underlined in B) or with part of two flanking β-strands, named DEN Fpep (amino acids between 88 and 123). DEN Fpep arrangement as it appears in the structure of E glycoprotein (C) solved by Modis et al. Citation[5]. Hydrophobic (blue), non-charged polar (green) and charged polar (red) residues are represented. This figure is reproduced in colour in Molecular Membrane Biology online.](/cms/asset/c19cbe9f-d154-409f-b8be-39f06051d2a0/imbc_a_263155_f0001_b.jpg)
Figure 2. Interaction of DEN Fpep with LUVs. (A) Normalized fluorescence emission spectra of DEN Fpep in buffer pH 5.5 (black solid line) or in the presence of 3.45 mM LUVs of POPC:POPG (4:1) (dotted line) or POPC (long dashes). (B) Quenching of fluorescence emission of fusion peptide by acrylamide in aqueous solution (closed circle), in the presence of 0.77 (open circle) or 3.45 mM (closed triangle) POPC:POPG 4:1 (LUVs). (C) LUV fusion induced by DEN virus fusion peptide. Fusion reaction was tracked using the Forster resonance energy transfer-based methodology. We used 0.77mM POPC:POPG (4:1) (closed circle), POPC:POPI (4:1) (closed up triangle), POPC:POPS (4:1) (closed square) and POPC 100% (closed down triangle) unlabeled vesicles or labeled with N-NBD-PE and N-Rh-PE. The final peptide concentration was 18 mM in 20 mM MES, 30 mM Tris buffer, pH 5.5.
Figure 3. Partition of DEN Fpep into LUVs (A) and extent of partition into POPC:POPG LUVs (B and C). (A) Fluorescence emission intensity of DEN Fpep normalized to [L] = 0 (I/Iw) upon titration with LUVs of POPC (open triangles), POPC:POPG (4:1) (filled squares), or POPC:Cholesterol 18% (filled triangle), 25% (open circle) and 33% (filled circle) – Equation 2 was used to fit the data. Fluorescence lifetimes upon titration with LUVs of POPC:POPG (4:1) are shown in open squares. (B) Fluorescence emission intensity of DEN Fpep at concentration of 9 (closed circle), 18 (open circle) and 36 mM (closed triangle) DEN Fpep normalized to [L] = 0 (I/Iw) upon titration with LUVs of POPC:POPG (4:1) in 20 µM MES, 30 µM Tris buffer, pH 5.5. (C) Linear relationship between [peptide] and [lipid] at the critical point. Total peptide and phospholipid concentrations at critical points for the POPG:POPC system, together with the corresponding fitting by Equation 3 (solid lines). Saturation points were obtained from the partition curves at different peptide concentrations (Figure 3B).
![Figure 3. Partition of DEN Fpep into LUVs (A) and extent of partition into POPC:POPG LUVs (B and C). (A) Fluorescence emission intensity of DEN Fpep normalized to [L] = 0 (I/Iw) upon titration with LUVs of POPC (open triangles), POPC:POPG (4:1) (filled squares), or POPC:Cholesterol 18% (filled triangle), 25% (open circle) and 33% (filled circle) – Equation 2 was used to fit the data. Fluorescence lifetimes upon titration with LUVs of POPC:POPG (4:1) are shown in open squares. (B) Fluorescence emission intensity of DEN Fpep at concentration of 9 (closed circle), 18 (open circle) and 36 mM (closed triangle) DEN Fpep normalized to [L] = 0 (I/Iw) upon titration with LUVs of POPC:POPG (4:1) in 20 µM MES, 30 µM Tris buffer, pH 5.5. (C) Linear relationship between [peptide] and [lipid] at the critical point. Total peptide and phospholipid concentrations at critical points for the POPG:POPC system, together with the corresponding fitting by Equation 3 (solid lines). Saturation points were obtained from the partition curves at different peptide concentrations (Figure 3B).](/cms/asset/33bd0fbe-0e5f-4c2a-96dc-88b79746a5a8/imbc_a_263155_f0003_b.gif)
Table I. Partition constants for different lipid compositions.
Figure 4. Effect of high ionic strength and pH on DEN Fpep partition into lipidic vesicles. Fluorescence emission intensity of DEN Fpep normalized to [L] = 0 (I/Iw) upon titration with LUVs of POPC:POPG (4:1): (A) in the presence of low (filled circles; no added NaCl) and high (200 mM NaCl, open circles) ionic strength; (B) at pH 5.5 (filled square) and pH 8.0 (open square). The final peptide concentration was 18 µM in 20 mM MES, 30 mM Tris buffer. 200 mM NaCl (A) leads to an intermediate situation, between the one obtained with POPC and POPC:POPG 4:1 without NaCl.
![Figure 4. Effect of high ionic strength and pH on DEN Fpep partition into lipidic vesicles. Fluorescence emission intensity of DEN Fpep normalized to [L] = 0 (I/Iw) upon titration with LUVs of POPC:POPG (4:1): (A) in the presence of low (filled circles; no added NaCl) and high (200 mM NaCl, open circles) ionic strength; (B) at pH 5.5 (filled square) and pH 8.0 (open square). The final peptide concentration was 18 µM in 20 mM MES, 30 mM Tris buffer. 200 mM NaCl (A) leads to an intermediate situation, between the one obtained with POPC and POPC:POPG 4:1 without NaCl.](/cms/asset/ced9b849-572a-40b8-aa0d-e708d893c9f3/imbc_a_263155_f0004_b.gif)
Figure 5. In-depth location of DEN Fpep in LUVs using Stern-Volmer Plots. Quenching by the derivatized lipophilic molecules 5NS (closed circles) and 16NS (open circles) in the presence of 0.77 mM (A) or 3.45 mM (B) POPC:POPG (4:1) vesicles. (C) Schematic representation of DEN Fpep location in membranes, using Parallax method Citation[22]. P represents the location of fusion peptide Trp in the external monolayer. The final peptide concentration was 18 µM in 20 mM MES, 30 mM Tris buffer. This figure is reproduced in colour in Molecular Membrane Biology online.
![Figure 5. In-depth location of DEN Fpep in LUVs using Stern-Volmer Plots. Quenching by the derivatized lipophilic molecules 5NS (closed circles) and 16NS (open circles) in the presence of 0.77 mM (A) or 3.45 mM (B) POPC:POPG (4:1) vesicles. (C) Schematic representation of DEN Fpep location in membranes, using Parallax method Citation[22]. P represents the location of fusion peptide Trp in the external monolayer. The final peptide concentration was 18 µM in 20 mM MES, 30 mM Tris buffer. This figure is reproduced in colour in Molecular Membrane Biology online.](/cms/asset/c4eeb34b-f8d0-4142-b39b-7f23ce30e354/imbc_a_263155_f0005_b.jpg)
Figure 6. LUV fusion induced by DEN virus fusion peptide. Fusion reaction was tracked using the Forster resonance energy transfer-based methodology. We used POPC:POPG (4:1) unlabeled vesicles or labeled with N-NBD-PE and N-Rh-PE, in the ‘saturated’ (high pep/lip) or non-saturated (low pep/lip) condition. The process was initiated by addition of the peptide and the FRET efficiency was accompanied for 10 min. The fusion index of 100% was calculated by adding 0.2% Triton final concentration. The final peptide concentration was 18 µM peptide in 10 mM MES, 20 mM TRIS buffer, pH 5.5.
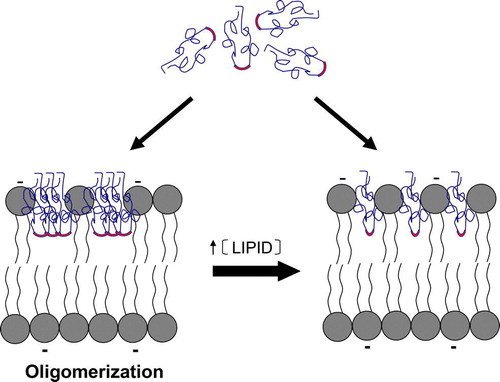
Figure 7. Schematic representation of the proposed mechanism of interaction between DEN Fpep and lipidic vesicles. DEN Fpep clearly interacts more extensively with anionic lipid containing vesicles. The mechanism of interaction depends on the macroscopic peptide:lipid ratio in the sample. At high ratio, oligomerization occurs due to quasi-complete crowding and is buried in an intermediate position of the outer hemilayer, in a compact (closely packed) conformation. Upon addition of lipid, at low peptide:lipid ratio, the peptide suffers a conformational change, probably small, leading to static quenching of Trp fluorescence, without changing its in-depth location. This figure is reproduced in colour in Molecular Membrane Biology online.