456
Views
14
CrossRef citations to date
0
Altmetric
Papers

Influence of the passenger domain of a model autotransporter on the properties of its translocator domain

, , , , &
Pages 192-202 | Received 23 May 2007, Published online: 09 Jul 2009

Figures & data

Figure 1.  Schematic representation of the proteins used in this work. The precursor of SphB1 is shown on the upper line, with SP, S, X and β representing the signal peptide, subtilase domain, ‘X’ domain and predicted β-barrel domain, respectively (approximately drawn to scale). The white boxes represent linker regions between the various domains, without well-predicted secondary structures. The hatched box represents a long predicted α-helix most likely corresponding to that of NalP. The arrowhead indicates the natural maturation site, and the sequence below corresponds to the N-terminus of the translocator in the outer membrane. The truncated versions of SphB1 were produced with an E. coli signal peptide (not represented) followed by an affinity Strep-tag (black box). The sequences underneath the various derivatives indicate the first residues of the SphB1 portion in each construct. The vertical arrows indicate the identified trypsin cleavage site in SphB1-X-α-β and SphB1-α-β. Its N-terminal sequence corresponds to residues 3–9 of the N-terminus of the translocator domain naturally found in the outer membrane of B. pertussis and arising from autoproteolytic cleavage of the protein.
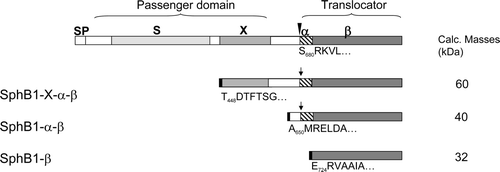
Figure 1.  Schematic representation of the proteins used in this work. The precursor of SphB1 is shown on the upper line, with SP, S, X and β representing the signal peptide, subtilase domain, ‘X’ domain and predicted β-barrel domain, respectively (approximately drawn to scale). The white boxes represent linker regions between the various domains, without well-predicted secondary structures. The hatched box represents a long predicted α-helix most likely corresponding to that of NalP. The arrowhead indicates the natural maturation site, and the sequence below corresponds to the N-terminus of the translocator in the outer membrane. The truncated versions of SphB1 were produced with an E. coli signal peptide (not represented) followed by an affinity Strep-tag (black box). The sequences underneath the various derivatives indicate the first residues of the SphB1 portion in each construct. The vertical arrows indicate the identified trypsin cleavage site in SphB1-X-α-β and SphB1-α-β. Its N-terminal sequence corresponds to residues 3–9 of the N-terminus of the translocator domain naturally found in the outer membrane of B. pertussis and arising from autoproteolytic cleavage of the protein.

Figure 2.  Folding state of purified SphB1-X-α-β and SphB1-α-β proteins. (A) Heat modifiability and trypsic digestion of the purified proteins. Lanes 1 and 3: purified SphB1-X-α-β and SphB1-α-β, respectively. The samples were heated for 10 min at 95°C. Lanes 2 and 4: SphB1-X-α-β and SphB1-α-β, non-heated samples. The proteins were subjected to SDS-PAGE, and the gels were coloured with Coomassie Blue. (B) CD spectra of SphB1 derivatives. Solid line, SphB1-α-β; dashed line, SphB1-X-α-β.
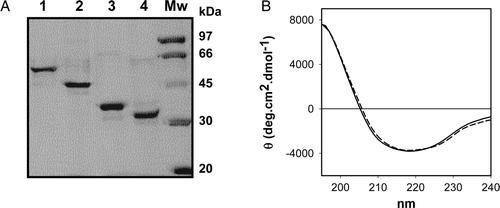
Figure 2.  Folding state of purified SphB1-X-α-β and SphB1-α-β proteins. (A) Heat modifiability and trypsic digestion of the purified proteins. Lanes 1 and 3: purified SphB1-X-α-β and SphB1-α-β, respectively. The samples were heated for 10 min at 95°C. Lanes 2 and 4: SphB1-X-α-β and SphB1-α-β, non-heated samples. The proteins were subjected to SDS-PAGE, and the gels were coloured with Coomassie Blue. (B) CD spectra of SphB1 derivatives. Solid line, SphB1-α-β; dashed line, SphB1-X-α-β.

Figure 3.  Dynamic light scattering analysis of the SphB1 recombinant proteins. (A and B) Volume size distribution of SphB1-α-β/DDM (solid line) and SphB1-X-α-β/DDM (dashed line) micelles without (A) and with 1% SDS (B). (C) Variation of the average diameter of SphB1-α-β/DDM (open symbols) and SphB1-X-α-β/DDM (filled symbols) micelles as a function of the SDS concentration. The lines are drawn as guides for the eye. The concentration of the protein is 1.2 mg/mL and 1.4 mg/mL for SphB1-α-β and SphB1-X-α-β, respectively.
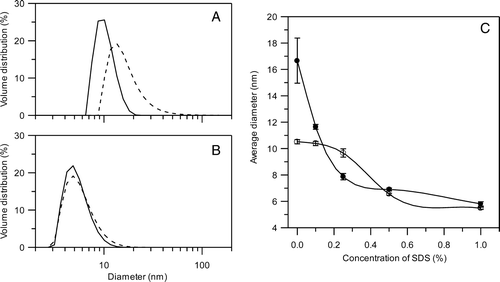
Figure 3.  Dynamic light scattering analysis of the SphB1 recombinant proteins. (A and B) Volume size distribution of SphB1-α-β/DDM (solid line) and SphB1-X-α-β/DDM (dashed line) micelles without (A) and with 1% SDS (B). (C) Variation of the average diameter of SphB1-α-β/DDM (open symbols) and SphB1-X-α-β/DDM (filled symbols) micelles as a function of the SDS concentration. The lines are drawn as guides for the eye. The concentration of the protein is 1.2 mg/mL and 1.4 mg/mL for SphB1-α-β and SphB1-X-α-β, respectively.

Figure 4.  Cross-linking of purified SphB1-X-α-β and SphB1-α-β. The proteins were incubated for 1 h with the DSS cross-linker at 2 mM. Lanes 1–4: SphB1-α-β. Lanes 5–8: SphB1-X-α-β. ‘+’ and ‘’ indicate the addition of cross-linker to the proteins and no addition, respectively. Lanes 2 and 6: the cross-linking reaction was performed in the absence of SDS, while lanes 3 and 7 and lanes 4 and 8 correspond to cross-linking experiments performed in the presence of 0.1% and 1% of SDS, respectively. ‘*’ labelled the presumed dimers. The 12.5% SDS-PAGE gel was stained with Coomassie blue.
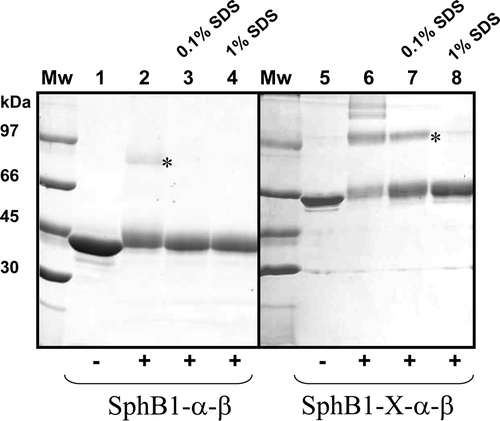
Figure 4.  Cross-linking of purified SphB1-X-α-β and SphB1-α-β. The proteins were incubated for 1 h with the DSS cross-linker at 2 mM. Lanes 1–4: SphB1-α-β. Lanes 5–8: SphB1-X-α-β. ‘+’ and ‘−’ indicate the addition of cross-linker to the proteins and no addition, respectively. Lanes 2 and 6: the cross-linking reaction was performed in the absence of SDS, while lanes 3 and 7 and lanes 4 and 8 correspond to cross-linking experiments performed in the presence of 0.1% and 1% of SDS, respectively. ‘*’ labelled the presumed dimers. The 12.5% SDS-PAGE gel was stained with Coomassie blue.

Figure 5.  Channel activity of the SphB1 recombinant proteins. (A) Current /voltage recordings, with triangular ramps applied at a rate of 10 mV/sec to azolectin planar lipid bilayers containing around 0.5 µg of purified derivatives. (I) SphB1-X-α-β; (II) SphB1-α-β; (III) SphB1-β. (B) Current traces from single channels and associated amplitude histograms. (I) SphB1-X-α-β, applied voltage: 160 mV; (II) SphB1-α-β, applied voltage: 60 mV; (III) SphB1-β, applied voltage: 20 mV. The buffer used was 1 M KCl, 10 mM Hepes, pH 7.4.
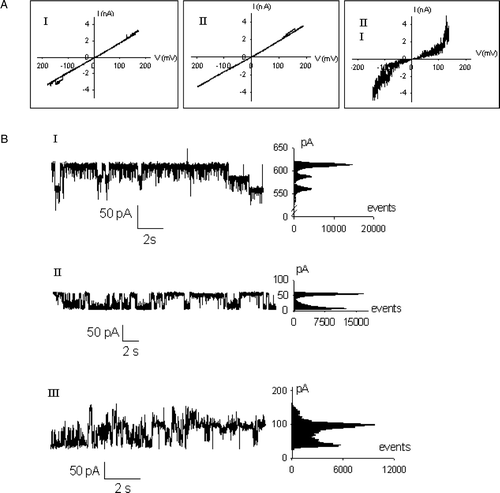
Figure 5.  Channel activity of the SphB1 recombinant proteins. (A) Current /voltage recordings, with triangular ramps applied at a rate of 10 mV/sec to azolectin planar lipid bilayers containing around 0.5 µg of purified derivatives. (I) SphB1-X-α-β; (II) SphB1-α-β; (III) SphB1-β. (B) Current traces from single channels and associated amplitude histograms. (I) SphB1-X-α-β, applied voltage: 160 mV; (II) SphB1-α-β, applied voltage: 60 mV; (III) SphB1-β, applied voltage: 20 mV. The buffer used was 1 M KCl, 10 mM Hepes, pH 7.4.
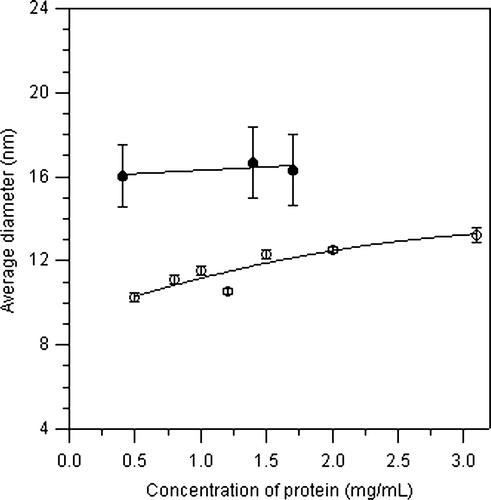
Figure S1.  Variation of the average diameter of SphB1-α-β/DDM (open symbols) and SphB1-X-α-β/DDM (filled symbols) micelles as a function of the protein concentration determined by DLS technique. These measurements were performed without SDS in the medium.

Figure S1.  Variation of the average diameter of SphB1-α-β/DDM (open symbols) and SphB1-X-α-β/DDM (filled symbols) micelles as a function of the protein concentration determined by DLS technique. These measurements were performed without SDS in the medium.

Reprints and Corporate Permissions

Please note: Selecting permissions does not provide access to the full text of the article, please see our help page How do I view content?

To request a reprint or corporate permissions for this article, please click on the relevant link below:

Academic Permissions

Please note: Selecting permissions does not provide access to the full text of the article, please see our help page How do I view content?

Obtain permissions instantly via Rightslink by clicking on the button below:

If you are unable to obtain permissions via Rightslink, please complete and submit this Permissions form. For more information, please visit our Permissions help page.