Figures & data
Figure 1. Effect of cholesterol levels on action potentials. (A) Effect of cholesterol depletion and enrichment by cholesterol-free (10 mM MβCD) and cholesterol-loaded MβCD (200 µM MβCD/Chol) on action potentials. The inset shows the superimposed AP, which were aligned at the time of maximal upstroke to allow comparison of the time course of the AP at double expanded time scale. (B) Changes in firing patterns of AP induced by cholesterol-free (representative of 6 neurons) and cholesterol-loaded MβCD (MβCD/Chol, representative of 5 neurons). (C) Plots of AP amplitude and time constant for control, depletion (MβCD) and enrichment (MβCD/Chol) of cholesterol (*p<0.05; **p<0.01).
Figure 2. Effect of cholesterol levels on the IK currents. (A) Representative current traces for the IK currents for cholesterol-depleted (10 mM MβCD) and enriched (200 µM MβCD/Chol) neurons. (B) Statistics on the ratio (IK/IKo) values of the steady-state outward IK current before (IKo) and after (IK) treatment with MβCD (1–10 mM) or MβCD/Chol. The steady-state outward IK current (+10 mV) was measured as mean value in a range from 85–100% of the current trace.
Figure 3. Effect of cholesterol levels on the IA currents. (A) Representative current traces for the IA currents for cholesterol depleted and enriched neurons. Inset: Time course of IA decay that was fitted with two exponential functions. Illustrated are representative IA current recorded after cholesterol depletion with 10 mM MβCD. A representative fitted curve is superimposed in grey (shown in red in Molecular Membrane Biology online). (B) Summary of parameters derived from the fitting at a test pulse of +10 mV in the control condition, in the presence of 10 mM MβCD, or in the presence of 200 µM MβCD/chol. (C) Statistics on the ratio (τfast/τfasto) values of the fast time constant component of IA before (τfasto) and after (τfast) treatment with MβCD (1–10 mM) or MβCD/Chol. Times of each experiment are indicated in the parenthesis.
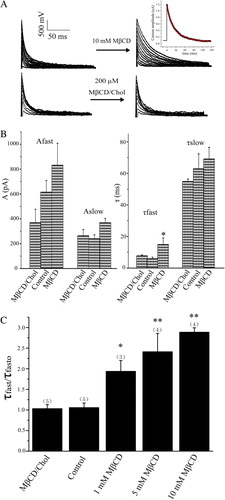
Figure 4. Activation and inactivation curves for IK (A) and IA. (B) in control and MβCD-exposed neurons. For activation curves, the normalized conductance (G/Gmax) is plotted against the membrane potential and fitted with the Boltzmann equation: V1/2 equals to −16.2 and −32.9 mV (control), or −9.2 and −35.5 mV (10 mM MβCD) for IK and IA, respectively. For inactivation curves, the normalized current (I/Imax) is plotted against the conditioning membrane potential and fitted with the Boltzmann equation: V1/2 equals to −73.8 and −86.6 mV (control), or −77.0 and −90.2 mV (10 mM MβCD) for IK and IA, respectively.
Figure 5. Effect of cholesterol depletion by MβCD on AP and outward K+ currents in the presence 4-AP and TEA. (A) APs generated from the same neuron in the control condition, in the presence of both TEA (5 mM) and 4-AP (3 mM), and in the presence of 10 mM MβCD after treatment with both TEA and 4-AP (representative of 5 neurons). (B) IK current from the same neuron at +30 mV in the control condition, in the presence of 5 mM TEA, and in the presence of 10 mM MβCD after treatment with TEA (n=4). (C) IA current from the same neuron at +30 mV in the control condition, in the presence of 4 mM 4-AP, and in the presence of 10 mM MβCD after treatment with 4-AP (n=5).