Figures & data
Figure 1. Generation of Slc2a8flox allele and targeting of Slc2a8. (A) Targeting strategy which resulted in the introduction of loxP sites upstream of exons 5, downstream of exon 7 of Slc2a8 and of a PGKneo/HSVtk cassette (Neo/tk) with a third loxP site. Verification of a single introduction of the targeting construct in the homologously recombined ES cell clone by Southern blot analysis as described in Materials and Methods (right panel). (B) After transient expression of Cre recombinase, the two types of ES cell clones carrying a deletion of exons 5–7 (d) or the floxed Slc2a8 allele (f) were identified by PCR with specific primers matching to a 5′-flanking region of exon 5 and the 3′-flanking region of exon 7 (upper panel). Identification of Slc2a8+/ + , Slc2a8+/ − , and Slc2a8−/ − littermates by PCR with specific primers as described under Materials and Methods (lower panel). (C) Slc2a8 mRNA levels of 10 weeks old Slc2a8+/ + and Slc2a8−/ − littermates in muscle, white adipose tissue (WAT), liver, testis and brain were assayed by quantitative RT-PCR as described in Materials and Methods (middle panel). mRNA levels of GLUT8, GLUT1, GLUT3, GLUT5 and GLUT6 in testis of Slc2a8+/ + and Slc2a8−/ − males were assayed by qRT-PCR (upper panel). (D) Immunohistochemical detection of GLUT8 in seminiferous tubules. Sections of testis from Slc2a8+/ + and Slc2a8−/ − mice were fixed with paraformaldehyde and incubated with the anti-GLUT8 antiserum. The immunostaining was performed with peroxidase-conjugated secondary antibody as described in Materials and Methods. Sections were counterstained with Mayer's hematoxylin (M, DNA ladders).
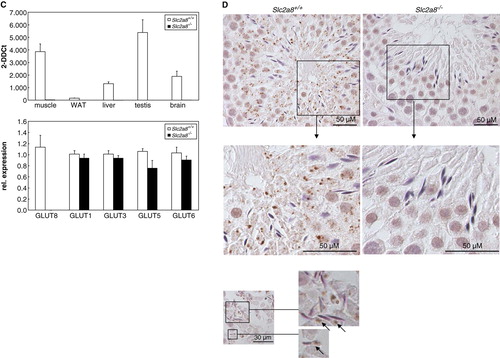
Figure 2. Characterization of body weight and body composition of wild-type and Slc2a8−/ − mice. (A) Body weight, (B) lean mass (upper panel) fat mass (lower panel) development of male Slc2a8+/ + and Slc2a8−/ − mice (means±SEM from 36 Slc2a8+/ + and 26 Slc2a8−/ − mice).
Table I. Comparison of plasma parameter in Slc2a8+/ + and Slc2a8−/ − males. Glucose, triacylglycerol (TG), free fatty acids (FFA) and insulin were measured in fed 12 to 15-week-old mice kept on standard diet. Data are shown as mean±SEM from 19–28 mice (as indicated in brackets).
Table II. Numbers of offspring of Slc2a8+/ + , Slc2a8+/ − , and Slc2a8−/ − genotypes obtained by crossing heterozygous mice.
Table III. Test of fertility of Slc2a8−/ − mice. Slc2a8+/ + males and females (n=7), Slc2a8−/ − males and Slc2a8+/ + females (n=8), and Slc2a8−/ − males and females (n=9), were paired and mean number of litters and number of pups were recorded over a period of 6 months.
Figure 3. Detection of intracellular (A) and mitochondrial (B) calcium concentrations and assessment of (C, E) mitochondrial transmembrane potential and (D) ATP levels of spermatozoa from Slc2a8+/ + and Slc2a8−/ − littermates. Spermatozoa were isolated of Slc2a8+/ + and Slc2a8−/ − males at the age of 10–12 weeks. (A) Intracellular calcium levels were detected after incubation of spermatozoa with Fluo2/AM ester, (B) mitochondrial calcium levels with Rhod2/AM ester and analysis by flow cytometry. (C) ATP levels were measured as described in Materials and Methods. (D, E) Mitochondrial membrane potential was observed after staining of spermatozoa with JC1 (E) and subsequent flow cytometry analysis (D). Data present mean±SEM of 10 wild-type and 12 knockout mice. This Figure is reproduced in colour in Molecular Membrane Biology online.
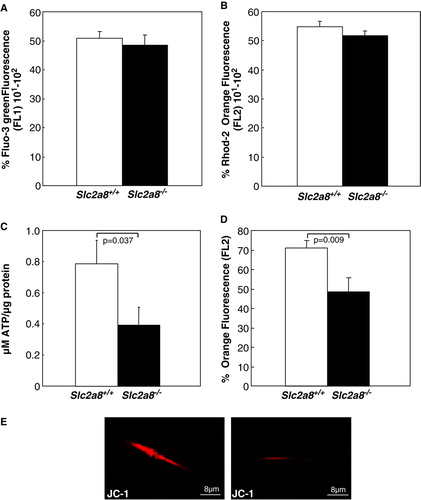
Figure 4. Uptake of [14C]-2deoxyglucose by sperm of 12 weeks old Slc2a8+/ + and Slc2a8−/ − mice. Each bar represents the mean and SE of observations from 6 mice.
![Figure 4. Uptake of [14C]-2deoxyglucose by sperm of 12 weeks old Slc2a8+/ + and Slc2a8−/ − mice. Each bar represents the mean and SE of observations from 6 mice.](/cms/asset/6f0c47e3-2910-4aff-80b3-417ec62e6ba5/imbc_a_285701_f0004_b.gif)
Figure 5. GLUT8 is required for normal sperm motility. Sperm count and sperm motility from Slc2a8+/ + and Slc2a8−/ − mice. Spermatozoa were isolated from epididymal tissues of 10–12 weeks old Slc2a8+/ + and Slc2a8−/ − mice and counted (left panel), and their mobility was analyzed as described in Materials and Methods (means±SEM from 6 mice of each genotype).
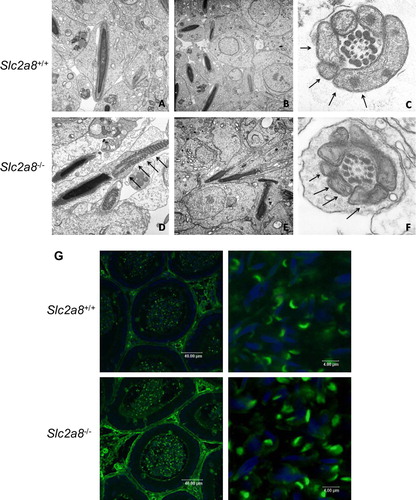
Figure 6. Electron microscopy of testis of Slc2a8+/ + (A–C) and Slc2a8−/ − mice (D–F) and analysis of cauda epididymal sperm with Pisum sativum agglutinine. (A) Early spermatides, (B, D, E) late spermatides, (C, F) cross section of a late spermatide, cut in the mid-piece region of the tail. Arrows depict the mitochondria (magnification approx. A and D×18,000; B and E×12,000; C and F×40,000). (G) Sections of the cauda epididymis of Slc2a8+/ + and Slc2a8−/ − males at the age of 10–12 weeks were stained with Pisum sativum agglutinine and analyzed by confocal laser scanning microscopy. Nuclei were co-stained with DAPI.