Figures & data
Figure 1. Folding of the WALP16 peptide at 300 K. Panel A: Starting from an extended conformation in solution (35 Å from the centre of the membrane) the peptide rapidly adsorbs to the membrane surface retaining its extended configuration. Interfacial folding is followed by membrane insertion. Panel B: Starting from an extended trans-membrane configuration the peptide first exits the membrane to fold at the interface, it subsequently reinserts to form the native state. The 3 chief states of the system are highlighted. (This Figure is reproduced in colour in Molecular Membrane Biology online).
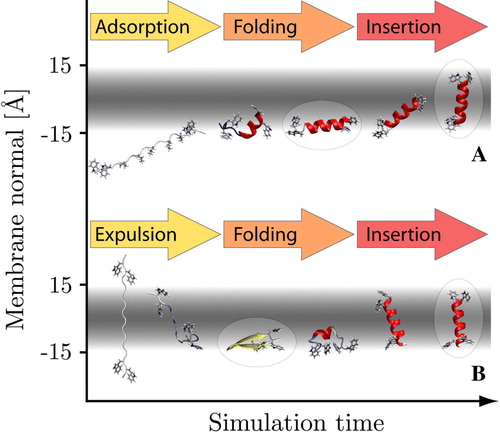
Figure 2. Representative conformers in the folding process of the KALP16 peptide in the 300 K replicas. Panel A: Surface-bound folding and repeated insertion of KALP with neutral N-terminal lysine residues. Panel B: Trans-membrane folding of KALP with all four terminal lysine residues in their charged states. The trans-membrane simulation displays little to no beta-sheet content, while it is more prominent in the surface-bound simulation. The native state conformers are identical (highlighted). (This Figure is reproduced in colour in Molecular Membrane Biology online).
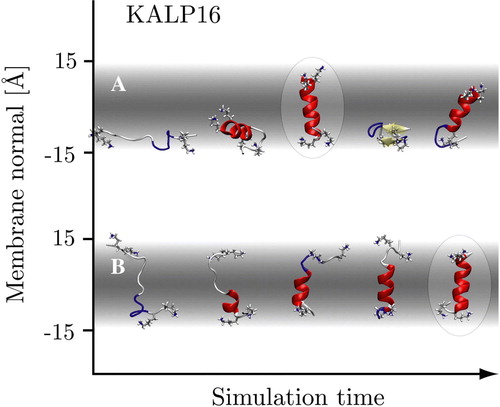
Figure 3. Scatter plot showing the distribution of tilt angles and centre of mass position of the WALP 16 peptide along the membrane normal for the 300 K replicas. Panel A: The surface bound starting configuration only translocates very late in the simulation and hence only explores one interface (see text). Panel B: The trans-membrane starting configuration has an almost equal probability of exiting the membrane on each leaflet exploring both interfaces. Inserted and surface bound configurations show clear tilt preferences matching the energy landscape of a rigid body scan (see A below). The roman numerals correspond to locations/orientations with respect to the membrane, depicted in (I & IV = M & MF, II & III = S & SF). (This Figure is reproduced in colour in Molecular Membrane Biology online).
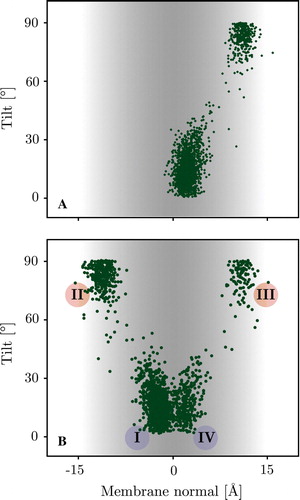
Figure 4. Panel A: Insertion energy landscape of a helical WALP16 conformer. The distinctive 4 minima are indicated. There are two trans-membrane configurations (I and IV), which are separated by a barrier, which is much higher than the barrier between the trans-membrane and its associated surface bound configurations (i.e., I↔II and III↔IV). The insertion energy minima match those of the 300 K replicas (c.f. ). Panel B: Orientations of the four minima in the membrane, the minimum energy pathway on the tilt/z surface connecting the four states shows the high translocation barrier, separating the states in each membrane leaflet (see text). (This Figure is reproduced in colour in Molecular Membrane Biology online).
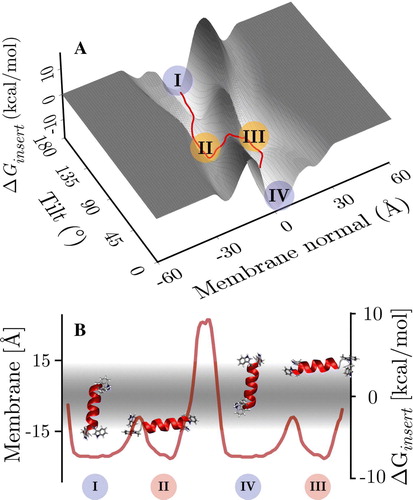
Figure 5. Thermodynamic analysis of the trans-membrane WALP peptide simulation, the surface bound simulation shows identical behaviour. Panel A: Average peptide helicity and beta-sheet content as a function of replica temperature (excluding equilibration). Panel B: Four-state fitting of all sampled states (S = surface unfolded, SF = surface folded, M = membrane unfolded, MF = membrane folded). The M state is hardly populated, reducing the system to three main states: S, SF and MF. The dots represent the direct populations measured for each temperature replica, while the thick line is the prediction from the thermodynamic four state model fit (see Methods). (This Figure is reproduced in colour in Molecular Membrane Biology online).
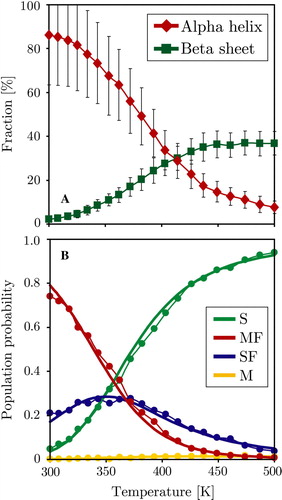
Figure 6. Temperature dependence of the transition free-energy between the four states (M, S, SF, MF). The four states and main associated transitions are shown at the bottom of the figure. Surface folding (S→SF) can be seen to be favourable below ∼350 K and the insertion of folded helices (SF→MF) is favourable below ∼370 K. Unfolded insertion (S→M) is strongly unfavourable at all temperatures as is intra-membrane unfolding (MF→M). Dots and thin lines represent the directly measured values, while the thick straight lines are the predicted thermodynamic behaviour from the four-state fitting (see Methods). (This Figure is reproduced in colour in Molecular Membrane Biology online).
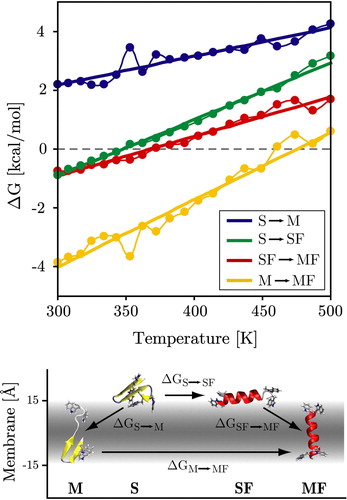
Table I. Entropic and energetic contributions to the free energies of the four states (M = membrane inserted unfolded, S = surface adsorbed unfolded, SF = surface adsorbed folded, and MF = membrane inserted folded) of the WALP peptide, as determined from a thermodynamic four-state fit. Shown are the relative energies ΔE (solute internal energy plus generalized Born solvation free energy, including solvent entropy), and solute entropies ΔS. The fitted free energy ΔG is given at 300 K. Also shown is ΔG as determined directly from Equation 5, and ΔE as determined from direct bin averages. The folded membrane inserted state (MF) has the lowest free energy, energy and entropy and is defined as the reference state zero.
Figure 7. Panel A: WALP peptide helicity (α) and position along the membrane normal (Z) at 353 K for the first 2 billion MC steps of both MC and REMC simulations. The REMC simulation exhibits smaller overall helicity due to the occasional swapping with only partially folded conformations from other replicas. Panel B shows the time-evolution of probabilities of the four states for the 353 K replica, while Panel C shows the equivalent behaviour for the 353 K simulation. The initial non-equilibrium folding process takes 1–2 billion MC steps and is similar in both simulations. The REMC simulation has a non-zero probability of the S state, while it decays to zero in the 353 K simulation. (This Figure is reproduced in colour in Molecular Membrane Biology online).
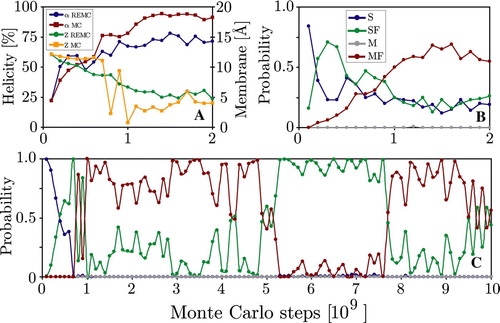
Figure 8. Secondary structure and membrane position of the WALP 353 K simulations. Panel A: Peptide helicity (blue line, left axis) and position along the membrane normal (z-position, red line, right axis) versus simulation time (MC step). Panel B: Simulation averages of secondary structure for each residue. (This Figure is reproduced in colour in Molecular Membrane Biology online).
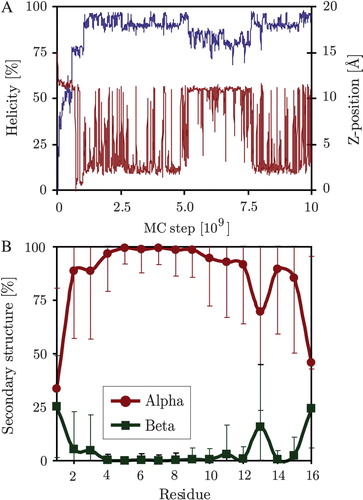
Table II. Helicity, position along the membrane normal (Z) and probability of the 4 states of the system for the 353 K replica (REMC) and a standard 353 K simulation (SMC).
Figure 9. Thermodynamic analysis of the surface bound KALP peptide simulation. Panel A: Average peptide helicity and beta-sheet content as a function of replica temperature (excluding equilibration). Panel B: Temperature dependence of the four chief states of the system. Panel C: Temperature dependence of the transition free-energy between states. SA = surface bound, MA = membrane inserted (irrespective of the fold). (This Figure is reproduced in colour in Molecular Membrane Biology online).
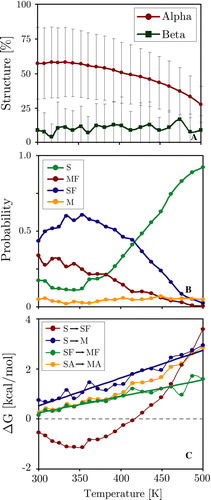
Figure Supplementory. Two spontaneous translocation events occurred for the WALP peptide during the surface bound simulations. In both cases translocation occurred at high temperatures (487–500 K), taking less than 106 MC steps. Panel A: The 362 K starting simulation. Panel B: The 461 K starting simulations. Both intermediary conformers contained large amounts of beta-structure and no helical content. Panel C: Simulation temperature (green = running average over 100 frames) of the 362 K starting simulation, the translocation event is indicated by a circle (at MC step 1.89×10⁹).