Figures & data
Table I. Lipid, protein contents and pTMA-DPH polarization ratio value for U (untreated), D (depleted), C+ (D complemented), C+ + (U complemented) and E+ (D ergosterol complemented) CHO/T7hMOR membranes.
Table II. Affinity values (Kd or Ki, nM) of agonists (DAMGO and Morphine) and antagonists (DPN and CTAP) in untreated (U) or modified (D or C+) membranes in absence or presence of Gpp(NH)p (100 µM).
Figure 1. DAMGO affinity parameters. (A) Saturation binding experiments for one campaign of measurements with DAMGO, in the absence (full symbols, black curves) or in the presence (empty symbols, grey curves) of Gpp(NH)p on U (•,○), D (▪,□) or C+ (♦,⋄) plasma membranes. (B) Relative differences of [3H]-DAMGO Bmax (%) between the absence and the presence of 100 µM Gpp(NH)p. All results are means for three independent experiments performed in duplicate. *Significantly difference from U sample at p<0.005.
![Figure 1. DAMGO affinity parameters. (A) Saturation binding experiments for one campaign of measurements with DAMGO, in the absence (full symbols, black curves) or in the presence (empty symbols, grey curves) of Gpp(NH)p on U (•,○), D (▪,□) or C+ (♦,⋄) plasma membranes. (B) Relative differences of [3H]-DAMGO Bmax (%) between the absence and the presence of 100 µM Gpp(NH)p. All results are means for three independent experiments performed in duplicate. *Significantly difference from U sample at p<0.005.](/cms/asset/2c9f8159-8a2e-43d5-8f33-c181682acfa5/imbc_a_320505_f0001_b.gif)
Figure 2. [35S]-GTPγS binding of DAMGO on untreated (U), cholesterol depleted (D), cholesterol complemented (C+) or cholesterol over-complemented membranes (C+ + ) prepared as described in Materials and methods. [35S]-GTPγS binding was determined with 0.1 nM [35S]-GTPγS in the presence of increasing concentrations of ligands (0.1 nM to 1 µM). All values are means for three independent experiments performed in triplicate.
![Figure 2. [35S]-GTPγS binding of DAMGO on untreated (U), cholesterol depleted (D), cholesterol complemented (C+) or cholesterol over-complemented membranes (C+ + ) prepared as described in Materials and methods. [35S]-GTPγS binding was determined with 0.1 nM [35S]-GTPγS in the presence of increasing concentrations of ligands (0.1 nM to 1 µM). All values are means for three independent experiments performed in triplicate.](/cms/asset/0f28ce2a-16cd-4aef-87f5-83cd600680ad/imbc_a_320505_f0002_b.gif)
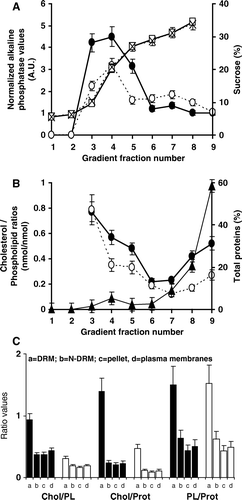
Figure 3. Characterization of sucrose gradient fractions from U or D T7hMOR/CHO membranes. (A) According to their normalized alkaline phosphatase (U: •), (D: ○) titration and sucrose concentration (U: □, D: X); (B) According to their cholesterol/phospholipid (Chol/PL) ratio contents (U: •), (D: ○), (▴) corresponds to the distribution of total proteins after a sucrose gradient. U and D total membranes gave identical results; (C) Lipid characteristics of various membrane fractions correspond to: a = DRMs (Fractions 3 + 4+5), b = N-DRMs (Fractions 6 + 7+8), c = pellet (Fraction 9) and d = total membranes, before (filled bars) and after cholesterol depletion (black bars) for cholesterol to phospholipid ratios (mol/mol), µ-moles of cholesterol per mg of proteins, and µ-moles of phospholipids per mg of proteins. Bars correspond to standard deviations of seven experiments before cholesterol depletion and six after. *The absence of PL in fractions 1 and 2 did not allow Chol/PL ratios to be calculated.

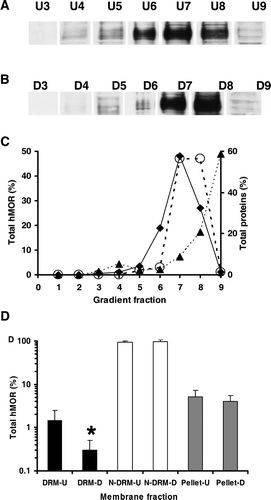
Figure 4. Western blot analysis of the distributions of T7hMOR in CHO membranes before (U) and after cholesterol depletion (D). (A) Western blot of hMOR in membrane fractions of solubilized membranes: lanes U3, U4, U5 (DRMs-U), lanes U6, U7, U8 (N-DRMs-U) and lane U9 (pellet of the gradient). After electrophoresis on SDS polyacrylamide gels, western blot analysis identified T7hMOR at approximately 70 kDa. We had previously verified the absence of T7hMOR from non-transfected CHO/K1 membranes. (B) Quantification of western blot of hMOR in gradient fractions from cholesterol-depleted membranes: lanes D3, D4, D5 (DRM), lanes D6, D7, D8 (N-DRM) and lane D9 (pellet) C) T7hMOR distribution, as percentages, in sucrose gradient fractions 1–9. (♦) and (○) indicate the distribution of hMOR in 15 µg of total proteins of U and D membranes respectively analyzed by Western blot (see Material and methods for the quantification); (▴) corresponds to the distribution of total proteins after a sucrose gradient. U or D total membranes gave identical results. (D) The corrected hMOR distribution in a sucrose gradient of combined U and D membrane fractions according to the criteria: DRMs (fractions 3–5), N-DRMs (fraction 6 to 8), and pellet (fraction 9). Western blot are performed with HRP conjugate anti-T7 antibody used as the probe (1/5000). All results are presented as means for three independent experiments performed in duplicate. *Significantly difference from DRU-U at p<0.01. See text for a quantification of hMOR distribution.

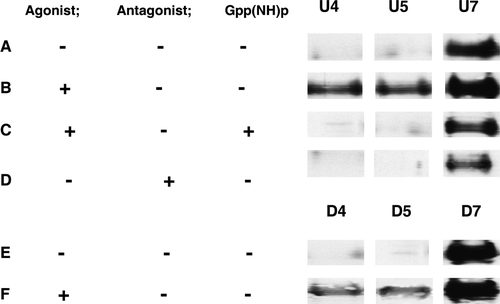
Figure 5. Western blot of hMOR in membrane fractions 4 and 7 of sucrose gradient from Triton X100 solubilized membranes. Equal amounts of proteins (15 µg) were loaded in all lanes. (A): U membranes in a basal state. (B): after DAMGO addition. (C): U membranes after DAMGO + Gpp(NH)p addition. (D): U membranes after CTAP addition. (E): D membranes in a basal state. (F): D membranes after DAMGO addition. See text for quantification of hMOR distribution.

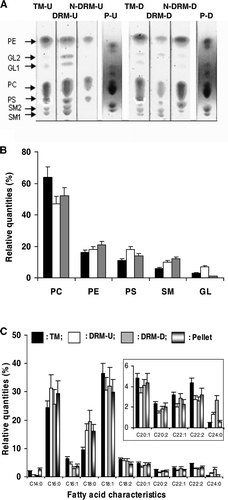
Figure 6. Lipid characteristics of TM, DRM, N-DRM and pellet (P) of U and D membranes. (A) TLC plates: TM-U and TM-D were membrane extracts from U and D membranes; DRM-U, N-DRM-U and P-U are from of U membranes, respectively; DRM-D, N-DRM-D and P-D are from of D membranes. (B) The percentage repartitions of lipid classes normalized for each deposited samples are shown: TM-U or TM-D (filled bars), DRM-U (open bars), DRM-D (grey bars). (C) Percentages of saturated or unsaturated fatty acid of TM-U (filled bars), DRM-U (open bars), DRM-D (grey bars), pellet (bicolor bars). Insert: Zoom of the zone C20:1-C24:0. CX:Y indicated: X: the number of carbon atoms in the fatty acid chain; Y: the number of double bonds. The ratios of unsaturated to saturated fatty acids for TM-U, DRM-U, DRM-D were: 1.7±0.1, 1.0±0.15, and 1.1±0.2, respectively. GL1, GL2 can correspond to glyco-lipids or spingoglycolipids that we were not able to differentiate.
