Figures & data
Table I. Primers used in the study.
Table II. Bacterial strains and plasmids.
Table III. Expression conditions, solubilization and activities of the 16 intact membrane sensor kinases of E. faecalis.
Figure 1. Expression of the 16 intact membrane sensor kinases of E. faecalis in E. coli BL21 (DE3). Cells harbouring pTTQ18His containing the recombinant gene for each of the intact membrane kinases were cultured as described in Methods, and mixed membrane proteins prepared by water lysis. Samples (15 µg) were separated and analysed by: (A) SDS-PAGE and visualized using Coomassie blue staining (upper panel); and (B) and (C), Western blotting to detect the engineered hexa-histidine tag at the C-terminus of each protein. Panel C shows a longer exposure required for detection of the successful expression of EF2298 (HK11). M, molecular mass standards. U, mixed membranes of an uninduced culture of E. coli BL21 (DE3)/pTTQHK01.This Figure is reproduced in colour in Molecular Membrane Biology online.
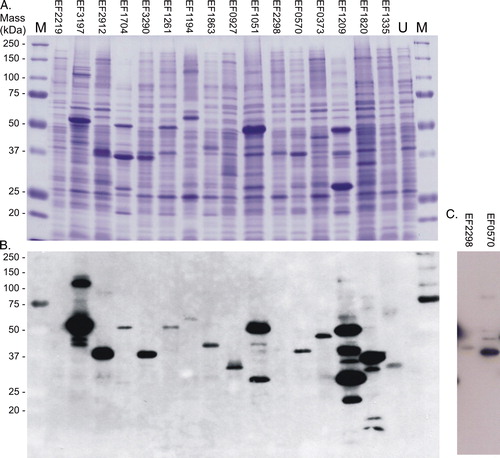
Figure 2. Autophosphorylation activities of intact sensor kinases in inner membrane vesicles. Inner membrane proteins (200 µg) were incubated at 24°C as described in Methods, and reactions initiated by the addition of 50 µM ATP containing 50 Ci [γ − 32P] or [γ − 33P] ATP. Samples (20 µl) were removed at the time points indicated, reactions terminated by the addition of 6 µl 4×SDS-PAGE sample loading buffer, and proteins separated by SDS-PAGE. Following electrophoresis, gels were washed, dried, and exposed to an image plate for quantitative analysis using a Fuji BAS1000 imaging analyzer system (Fujifilm Co., Japan). (A) Image and (B) quantitative representation of the data for each radiolabelled phosphorylated protein during autophosphorylation. The identities of the phosphorylating proteins (indicated by the arrows) were verified by comparisons with Western data. Graphs show the pixel counts relative to the maximum value attained during the assays. The numbers above each panel indicate the time sampled (minutes) after reaction initiation.
![Figure 2. Autophosphorylation activities of intact sensor kinases in inner membrane vesicles. Inner membrane proteins (200 µg) were incubated at 24°C as described in Methods, and reactions initiated by the addition of 50 µM ATP containing 50 Ci [γ − 32P] or [γ − 33P] ATP. Samples (20 µl) were removed at the time points indicated, reactions terminated by the addition of 6 µl 4×SDS-PAGE sample loading buffer, and proteins separated by SDS-PAGE. Following electrophoresis, gels were washed, dried, and exposed to an image plate for quantitative analysis using a Fuji BAS1000 imaging analyzer system (Fujifilm Co., Japan). (A) Image and (B) quantitative representation of the data for each radiolabelled phosphorylated protein during autophosphorylation. The identities of the phosphorylating proteins (indicated by the arrows) were verified by comparisons with Western data. Graphs show the pixel counts relative to the maximum value attained during the assays. The numbers above each panel indicate the time sampled (minutes) after reaction initiation.](/cms/asset/febc5b01-64b4-4400-8f6c-b94f366cd8fd/imbc_a_336155_f0002_b.gif)

Figure 3. One-step purification of the expressed intact membrane sensor kinases of E. faecalis. Following solubilization, proteins were purified by nickel affinity as described in Methods. Samples (10 µg) were analysed by: (A) separation on SDS-polyacrylamide gels and staining with Coomassie Blue, and% purity determined by densitometry; and (B) Western blot analysis using an INDIATM His probe. M, molecular mass markers. This Figure is reproduced in colour in Molecular Membrane Biology online.
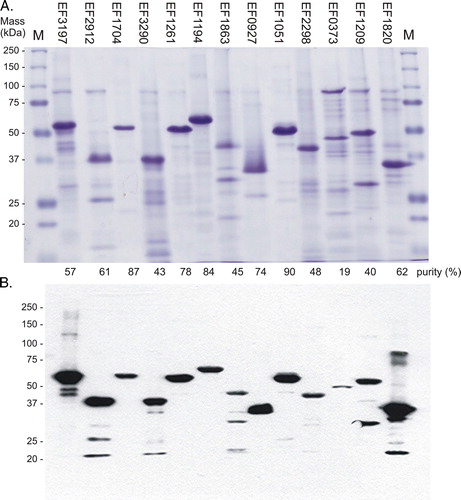
Figure 4. Autophosphorylation activities of purified intact sensor kinases. Purified proteins (600–1000 pmoles) were added to reaction buffer, and autophosphorylation initiated using radiolabelled ATP in a total reaction volume of 150 µl, as described in Methods. Sample volumes (15 µl) were removed at the time points indicated. (A) Image and (B) quantitative representation of the data for each radiolabelled phosphorylated protein during autophosphorylation. Phosphorylating proteins (shown by the arrows) were verified by mass determinations and comparisons with Western data. Graphs show the pixel counts relative to the maximum value attained during the assays.

Figure 5. Effect of the GBAP peptide pheromone on autophosphorylation activity of FsrC and other purified sensor kinases. Reactions contained 80 pmoles purified protein preincubated in reaction buffer for 20 min in the presence or absence of synthetic GBAP, prior to the initiation of autophosphorylation reactions in a total reaction volume of 15 µl. After 60 min, samples were removed to 5 µl stop buffer. The quantity of 32P associated with each protein was determined by SDS-PAGE followed by autoradiography and phosphoimager analysis. All reactions (including controls) contained a final concentration of 3.4% acetonitrile (used to dissolve GBAP). (A) FsrC-P levels in response to increasing GBAP. Means of duplicate data are presented (except for 0.7, 21.3 and 170.7 µM GBAP datapoints, for which single measurements were made), and averaged datapoints varied by±0.07–5.43%. (B) Comparison of responses to 10.7 µM GBAP by six purified sensors. Single data measurements are shown for all proteins except FsrC (EF1820) which shows the mean and standard deviation derived from triplicate data. Autoradiographs of individual data are also shown.
Figure 6. Effects of dithiothreitol (DTT) and reduced (GSH) and oxidized (GSSG) glutathione on autophosphorylation activity of intact VicK. Each reaction contained either membrane-bound VicK in E. coli membranes (20 µg) (A), (C) & (E), or 60–80 pmoles purified VicK (B) and (D), which were incubated in reaction buffer for 20 min in the presence or absence of DTT (A) and (B), or 5 and 25 mM concentrations of GSH or GSSG (C), (D) & (E), prior to the initiation of autophosphorylation reactions in a reaction volume of 15 µl. Reactions were terminated with stop buffer after 2 min (membrane-bound VicK [A] and [C]), or 40 min (purified protein [B] and [D]) when VicK was autophosphorylating, or after 40 min for membrane-bound protein, when VicK is dephosphorylating (E). The quantity of 33P associated with VicK was then determined by SDS-PAGE followed by autoradiography and phosphoimager analysis. Reactions were performed in triplicate. Autoradiographs show one individual blot; numbers beneath are the phosphorimager data presented as a mean of the triplicate data.
![Figure 6. Effects of dithiothreitol (DTT) and reduced (GSH) and oxidized (GSSG) glutathione on autophosphorylation activity of intact VicK. Each reaction contained either membrane-bound VicK in E. coli membranes (20 µg) (A), (C) & (E), or 60–80 pmoles purified VicK (B) and (D), which were incubated in reaction buffer for 20 min in the presence or absence of DTT (A) and (B), or 5 and 25 mM concentrations of GSH or GSSG (C), (D) & (E), prior to the initiation of autophosphorylation reactions in a reaction volume of 15 µl. Reactions were terminated with stop buffer after 2 min (membrane-bound VicK [A] and [C]), or 40 min (purified protein [B] and [D]) when VicK was autophosphorylating, or after 40 min for membrane-bound protein, when VicK is dephosphorylating (E). The quantity of 33P associated with VicK was then determined by SDS-PAGE followed by autoradiography and phosphoimager analysis. Reactions were performed in triplicate. Autoradiographs show one individual blot; numbers beneath are the phosphorimager data presented as a mean of the triplicate data.](/cms/asset/64b3f53f-4391-433b-9905-cbbde5f085fb/imbc_a_336155_f0006_b.gif)
Figure 7. Effect of redox potential on phosphotransfer from VicK to VicR in vitro using DTT as reducing agent. 420 pmoles VicK were permitted to autophosphorylate for 15 min in the presence of either 0.5 mM or 100 mM DTT in 130 µl reaction volumes. 13 µl samples were removed to stop buffer prior to the addition of 252 pmoles VicR to the remaining 378 pmoles VicK (1.5:1 VicK:VicR). Samples (50 pmoles) were removed to stop buffer at regular intervals up to 2 h. Autoradiograph and graphical representation of quantitative data obtained using (A) 0.5 mM DTT, and (B) 100 mM DTT.