Figures & data
Table I. Transport properties of wild-type and mutant forms of GalP. Transport activities are from the measurement of [3H]-D-galactose uptake into energised whole cells expressing WT GalP or mutants. Vmax:Km ratios were taken as a measure of transport efficiency. The data are taken from Reference Citation[12]a and G. Psakis, S. A. Baldwin & P. J. F. Henderson (unpublished work)b.
Figure 1. SDS-PAGE analysis of E. coli inner membrane preparations from cells expressing WT and mutant forms of GalP. The arrow indicates the position of GalP and the % expression of GalP in the different samples determined by densitometric analysis of the gel stained with Coomassie Brilliant Blue is as follows: WT (40%), W56F (32%), W239F (32%), R316W (38%), T336Y (35%) and W434F (40%).
Figure 2. 13C solid-state NMR experiments to detect the interactions of D-[U-13C]glucose with GalP in E. coli inner membrane preparations. (a) A CP-MAS spectrum of membranes containing WT GalP and 10 mM substrate. The peaks for glucose (inset) are labelled according to the numbering system for the chemical structure; PC indicates the peak for the membrane phosphatidylcholine N-CH3 groups. (b) A CPPI spectrum of the same sample.
![Figure 2. 13C solid-state NMR experiments to detect the interactions of D-[U-13C]glucose with GalP in E. coli inner membrane preparations. (a) A CP-MAS spectrum of membranes containing WT GalP and 10 mM substrate. The peaks for glucose (inset) are labelled according to the numbering system for the chemical structure; PC indicates the peak for the membrane phosphatidylcholine N-CH3 groups. (b) A CPPI spectrum of the same sample.](/cms/asset/145eb8b3-af67-45f0-a1f4-44e3671be7a5/imbc_a_337363_f0002_b.gif)
Figure 3. Cross-polarization (CP) build-up curves measured from the peak intensities for C-5 of glucose (10 mM) in membranes containing: (a) WT GalP or the mutants (b) W239F, (c) W434F, (d) W56F, (e) T336Y and (f) R316W. The concentration of GalP is approximately 1 mM in all samples. Peak intensities are normalized to the intensity for each sample at a contact time of 10 msec. Error bars represent the level of the noise.
Figure 4. 13C CP-MAS NMR spectra (obtained with a contact time of 10 msec) of E. coli inner membrane preparations containing: (a) WT GalP or the mutants (b) W239F, (c) W434F, (d) W56F, (e) T336Y and (f) R316W, all with 10 mM D-[U-13C]glucose. Each spectrum was obtained with 3072 scans over 52 min. In each panel the spectra for the total binding of D-[U-13C]glucose (T = specific + non-specific binding) in WT or mutant GalP membranes (left) are shown normalized to the background signal intensity (in the 10–80 ppm and 160–180 ppm frequency ranges) so as to achieve the closest correspondence of the background signals in each spectrum. The right spectrum in each panel (S = specific binding) shows peaks only from D-[U-13C]glucose bound specifically to GalP. These were obtained by subtracting from each scaled spectrum (representing specific + non-specific binding on the left) the spectrum of the same samples obtained after incubation in the presence of the inhibitor forskolin (2 mM) to block glucose from the specific binding site in GalP (representing non-specific binding). The residual peak intensities thus reflect the binding affinities of WT GalP and the mutant forms for D-glucose.
![Figure 4. 13C CP-MAS NMR spectra (obtained with a contact time of 10 msec) of E. coli inner membrane preparations containing: (a) WT GalP or the mutants (b) W239F, (c) W434F, (d) W56F, (e) T336Y and (f) R316W, all with 10 mM D-[U-13C]glucose. Each spectrum was obtained with 3072 scans over 52 min. In each panel the spectra for the total binding of D-[U-13C]glucose (T = specific + non-specific binding) in WT or mutant GalP membranes (left) are shown normalized to the background signal intensity (in the 10–80 ppm and 160–180 ppm frequency ranges) so as to achieve the closest correspondence of the background signals in each spectrum. The right spectrum in each panel (S = specific binding) shows peaks only from D-[U-13C]glucose bound specifically to GalP. These were obtained by subtracting from each scaled spectrum (representing specific + non-specific binding on the left) the spectrum of the same samples obtained after incubation in the presence of the inhibitor forskolin (2 mM) to block glucose from the specific binding site in GalP (representing non-specific binding). The residual peak intensities thus reflect the binding affinities of WT GalP and the mutant forms for D-glucose.](/cms/asset/95d11a20-2435-4e69-bc0f-b8e790bf2c13/imbc_a_337363_f0004_b.gif)
Figure 5. Integral values for total binding of D-[U-13C]glucose (T) and for D-[U-13C]glucose bound specifically to WT GalP and the 5 mutants (S). Integration of background normalized spectra was performed over the entire resonance frequency range for D-[U-13C]glucose from 55–100 ppm. For the WT protein, T(1) and T(2) represent integrals for total binding of the substrate to 2 membrane samples prepared independently, to show the reproducibility of the measurement.
![Figure 5. Integral values for total binding of D-[U-13C]glucose (T) and for D-[U-13C]glucose bound specifically to WT GalP and the 5 mutants (S). Integration of background normalized spectra was performed over the entire resonance frequency range for D-[U-13C]glucose from 55–100 ppm. For the WT protein, T(1) and T(2) represent integrals for total binding of the substrate to 2 membrane samples prepared independently, to show the reproducibility of the measurement.](/cms/asset/6927f71b-3f5d-4f8b-bf75-a719ca222664/imbc_a_337363_f0005_b.gif)
Figure 6. A 3D model of GalP based on the crystal structure of the E. coli glycerol-3-phosphate transporter GlpT, in a conformation in which the substrate-binding site is open to the cytoplasmic face of the membrane Citation[22]. The putative positions of the residues mutated in the present study are shown, together with tryptophan residues, W371 and W395, predicted to be close to the substrate-binding site. The model is viewed from the periplasmic face (top) and from the side (bottom). In the latter view, the likely approximate boundaries of the lipid bilayer are indicated. This Figure is reproduced in colour in Molecular Membrane Biology online.
![Figure 6. A 3D model of GalP based on the crystal structure of the E. coli glycerol-3-phosphate transporter GlpT, in a conformation in which the substrate-binding site is open to the cytoplasmic face of the membrane Citation[22]. The putative positions of the residues mutated in the present study are shown, together with tryptophan residues, W371 and W395, predicted to be close to the substrate-binding site. The model is viewed from the periplasmic face (top) and from the side (bottom). In the latter view, the likely approximate boundaries of the lipid bilayer are indicated. This Figure is reproduced in colour in Molecular Membrane Biology online.](/cms/asset/440e997e-7117-46fc-a974-17eac6d4159e/imbc_a_337363_f0006_b.jpg)
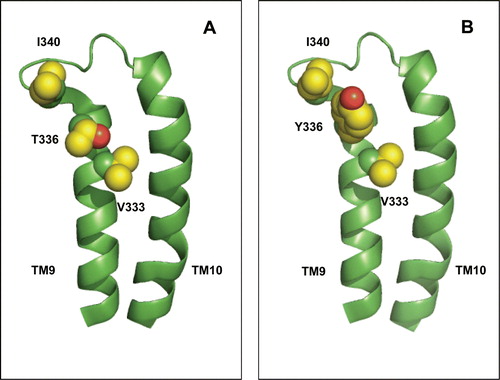
Figure 7. Possible interaction between TM9 residue 336 and adjacent parts of the protein. (A) Wild-type protein bearing threonine at position 336. (B) Mutant protein bearing tyrosine at position 336. The predicted location of V333, the backbone carbonyl of which is within H-bonding distance of the T336 side-chain, and of the bulky residue I340 in the TM9-TM10 loop, are indicated. The indicated residues are shown in space-filled representation. This Figure is reproduced in colour in Molecular Membrane Biology online.