Figures & data
Table I. Lipid types, lipid numbers and box sizes used in simulations.
Figure 1. The Coarse-Grain Database. This Figure shows a screen shot of the database entry for a ligand gated ion channel from E. chrysanthemi Citation[50] pdb code 2VL0. Each of the picture ‘tabs’ provides a link to downloadable data files.
![Figure 1. The Coarse-Grain Database. This Figure shows a screen shot of the database entry for a ligand gated ion channel from E. chrysanthemi Citation[50] pdb code 2VL0. Each of the picture ‘tabs’ provides a link to downloadable data files.](/cms/asset/5d484bbd-ab21-4a0e-b403-d069526eac5b/imbc_a_344821_f0001_b.jpg)
Figure 2. Positions and orientations of MscS, FLAP and the KvAP sensor domain. The position of MscS (top), FLAP (middle) and KvAP voltage sensor (bottom) in a DPPC bilayer. The protein structure is shown as a ribbon diagram generated from the original pdb structure following superposition with the simulated coarse-grained structure. Phosphate particles are shown as grey spheres.
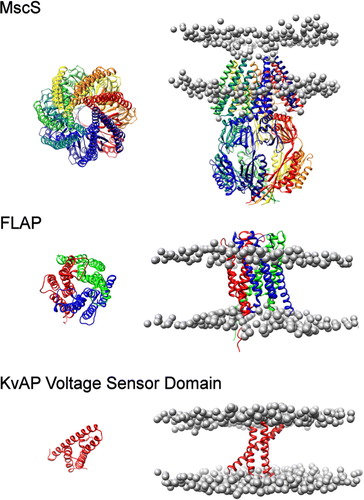
Figure 3. Bilayer perturbation around MscS. Contour plots (on the left hand side) illustrating the change in the extent of the perturbation of the lipid bilayer around MscS with lipid tail length. The right hand side shows the orientation of the protein. The data were calculated using a set of structures with the protein superposed in the x-y plane such that the protein had the same orientation in all cases. The data were split into 5×5 Å bins for analysis. Smoothed contour plots are coloured according to the mean distance of the phosphate headgroups from the bilayer centre of mass in each bin. The variation in the data was similar in each bin, with standard deviation values typically in the range of 2–3 Å. The data show that the pattern of bilayer distortion is similar for different lipid types with the extent depending upon the hydrophobic mismatch. The upper leaflets for each lipid show isotropic distortion. The lower leaflets for each lipid show distinct areas of distortion caused by Arg 59.
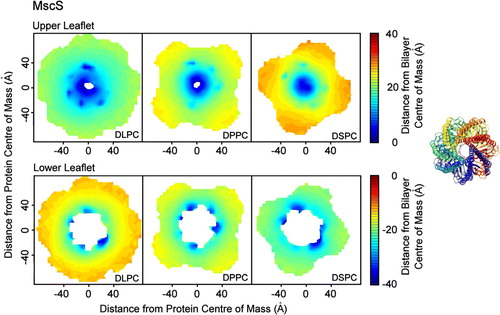
Figure 4. Bilayer distortion as a function of distance from the protein. The upper four panels show the mean phosphate radial distance from the bilayer centre of mass in the upper and lower leaflets as a function of the distance from the protein centre of mass of MscS and FLAP. In each case the pattern of bilayer distortion is similar irrespective of lipid tail length. The lower two panels give the bilayer thickness as function of the distance from the protein centre of mass.
Figure 5. Bilayer perturbation around FLAP. Contour plots (on the left hand side) showing the change in the extent of the perturbation of the lipid bilayer around FLAP with lipid tail length. The right hand side shows the orientation of the protein. The analysis was performed as described for MscS. The patterns of distortion are similar for all lipid types, with the extent dependent on the bilayer width. The upper leaflets for each lipid show three areas where the headgroups are drawn up (red sections). The lower leaflets for each lipid show only two areas where the headgroups are drawn up (red sections) as one chain in the structure of FLAP is missing eight residues.
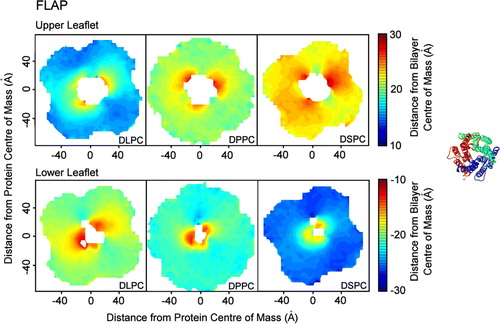
Figure 6. Bilayer distortion by the KvAP voltage sensor. The mean phosphate distance from the bilayer centre of mass in the (A) upper and (B) lower leaflets is shown as a function of distance from the protein surface for the voltage sensor (pdb code 1ORS). The bilayer (phosphate-phosphate) thickness is shown in (C). Five simulations were run, with a DPPC:DPPG ratio of 1:0, 9:1, 6:1, 3:1 and 1:1. The extent of the distortion is similar in all simulations, with no correlation between the extent of the distortion and the concentration of anionic lipids.