Figures & data
Figure 1. Structure of 1OKC and CATR. (A) Structure of protein, viewed perpendicular to approx. 3× axis; rainbow scale N = blue, C = red. The dotted line represents the approximate position of the lipid bilayer headgroups. (B) View down the approx 3×, CATR in pink, domains: D1 (residues 2–101), D2 (residues 102–201), and D3 (residues 202–292). The transmembrane helices H1 to H6 are indicated.
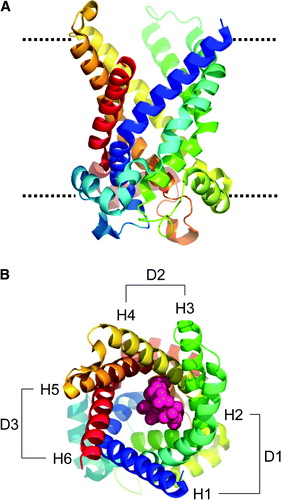
Figure 2. (A) Interaction between the side chain of R279 and the carboxylate groups of CATR and between the side chains of R279 and E29. This snapshot is taken from simulation 1OKC-CATR, at t = ∼18.5 ns of the production simulation. (B) Schematic representation of key binding site interactions of 1OKC with CATR as seen in the X-ray structure. The inhibitor forms van der Waals contacts with residues L127, V130 and I183, and the diterpene moiety stacks onto Y186. The glucose moiety faces the opening of the cavity and there are polar interactions between the sulphate groups of this moiety and the sidechains of R187, K91 and N87. A salt bridge forms between one carboxylate and R79, whilst the second carboxylate forms an interaction with R279 via a water molecule Citation[8]. There is also an interaction between the hydroxyl group directly attached to the pentyl ring of CATR and residues D231 and R234.
![Figure 2. (A) Interaction between the side chain of R279 and the carboxylate groups of CATR and between the side chains of R279 and E29. This snapshot is taken from simulation 1OKC-CATR, at t = ∼18.5 ns of the production simulation. (B) Schematic representation of key binding site interactions of 1OKC with CATR as seen in the X-ray structure. The inhibitor forms van der Waals contacts with residues L127, V130 and I183, and the diterpene moiety stacks onto Y186. The glucose moiety faces the opening of the cavity and there are polar interactions between the sulphate groups of this moiety and the sidechains of R187, K91 and N87. A salt bridge forms between one carboxylate and R79, whilst the second carboxylate forms an interaction with R279 via a water molecule Citation[8]. There is also an interaction between the hydroxyl group directly attached to the pentyl ring of CATR and residues D231 and R234.](/cms/asset/6b9f9815-bad4-4a6b-bf07-da511353daa5/imbc_a_346095_f0002_b.gif)
Figure 3. Set-up and progress of simulation, illustrated for simulation 1OKC. The phosphorus atoms of the lipid headgroups are shown as spheres, and the protein as a ribbon. Snapshots are shown at the start of the simulation (A, t = 0 ns), at the end of equilibration (B, t = 2 ns), and at the end of the simulation (C, t = 22 ns).
Table I. Summary of simulations.
Figure 4. Conformational drift of the three domains, for simulations: 1OKC, 1OKC-W, 1OKC-CATR, and 1OKC-CATR-W RMSDs. In each case the Cα RMSD of the domain is shown as a function of time, relative to the initial structure of that domain. Black = D1 (residues 2–101), red = D2 (residues 102–201), and green = D3 (residues 202–292).
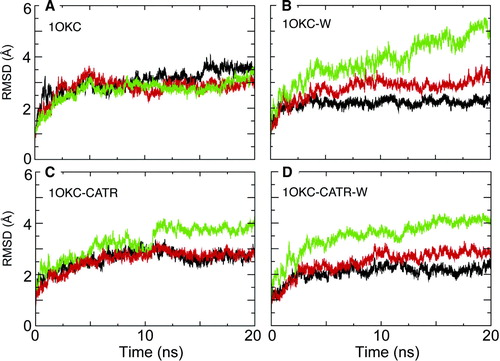
Figure 5. Principal components analysis of simulations: A 1OKC, and B 1OKC-CATR-W. In each case the simulated motions are projected along eigenvector 1, with each trajectory fitted to the t=0 ns structure. The protein is drawn in tube representation and coloured to shown the range of the motions. For 1OKC-CATR-W the major motions are restricted to the loop regions, in particular loop M3 (highlighted by the red circle).
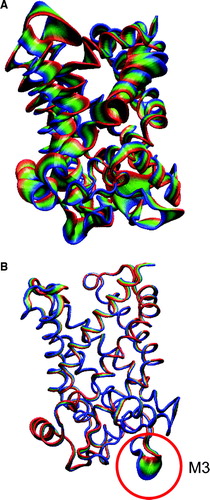
Figure 6. (A) The inner helix bundle formed by H1, H3, and H5, illustrated by the X-ray structure. Left to right: Side view; top view from cytosol. The white spheres indicate the positions of the key prolines (P27 in H1 [white], P132 in H3 [black], and P229 in H5 [grey]). (B) and (C) Snapshots of H1 (B) and H5 (C) from all four simulations. In each case structures saved every 2 ns are shown, superimposed in on the residues C-terminal to the key proline (indicated by the arrows).
![Figure 6. (A) The inner helix bundle formed by H1, H3, and H5, illustrated by the X-ray structure. Left to right: Side view; top view from cytosol. The white spheres indicate the positions of the key prolines (P27 in H1 [white], P132 in H3 [black], and P229 in H5 [grey]). (B) and (C) Snapshots of H1 (B) and H5 (C) from all four simulations. In each case structures saved every 2 ns are shown, superimposed in on the residues C-terminal to the key proline (indicated by the arrows).](/cms/asset/672d7aaa-b5d3-4955-adab-41618403c909/imbc_a_346095_f0006_b.gif)
Figure 7. Swivel and kink angles shown as polar plots (see e.g. Citation[27], Citation[34]), for motions about the proline-induced molecular hinges in columns: (A) helix H1, (B) helix H3, and (C) helix H5. In each case the plots are shown for simulations 1OKC, 1OKC-W, 1OKC-CATR and 1OKC-CATR-W.
![Figure 7. Swivel and kink angles shown as polar plots (see e.g. Citation[27], Citation[34]), for motions about the proline-induced molecular hinges in columns: (A) helix H1, (B) helix H3, and (C) helix H5. In each case the plots are shown for simulations 1OKC, 1OKC-W, 1OKC-CATR and 1OKC-CATR-W.](/cms/asset/dbd3719d-ee59-4b4a-9bff-0f410c7580bc/imbc_a_346095_f0007_b.gif)
Figure 8. Interdomain salt-bridges. Interatomic distances as a function of time are shown for the charged pair interactions (E29(H1)-R137(H3); D134(H3)-R234(H5); and D231(H5)-K29(H1)) between the PXX(-)XX(+) motifs of adjacent helices: (A) H1-H3, (B) H3-H5, and (C) H5-H1. Black: 1OKC; red: 1OKC-W; green: 1OKC-CATR; blue: 1OKC-CATR-W. (Running averages were applied every 10 data points to reduce the effect of noise and thus simplify the plots. The distances computed are those between the centre of mass of the relevant groups of atoms, e.g. the C, O, O atoms of a carboxylate.)
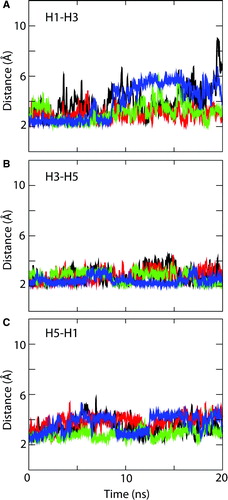
Figure 9. Snapshots of the H1-H3 salt bridge interactions in (A) the crystal structure, (B) at the end of simulation 1OKC, and (C) at the end of simulation 1OKC-CATR-W. The key acidic (E29, red) and basic (R137 or R279, blue) residues are shown as van der Waals radius spheres.
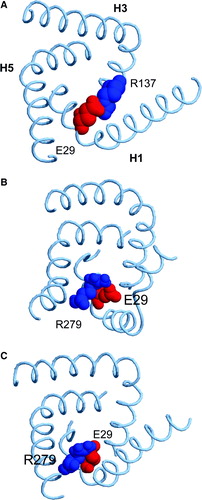
Figure S1. Secondary structure as a function of time for simulations: (A) 1OKC; (B) 1OKC-CATR; and (C) 1OKC-CATR-W. The colour code for secondary structure is as follows: blue = α-helix; yellow = turn; green = bend; purple = Π-helix; grey = 310-helix; and white = coil.
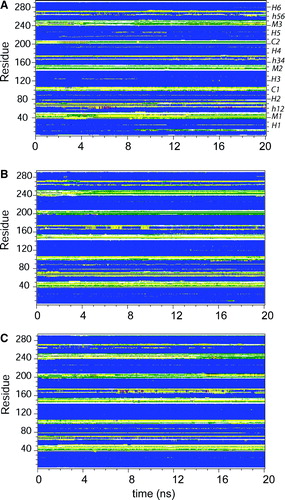
Figure S2. Root mean square fluctuation (RMSF) of Cα atoms, averaged over the final 5 ns of each simulation. Black line = 1OKC; red line = 1OKC-W; green line = 1OKC-CATR; and blue line = 1OKC-CATR-W. The labels are of contacts between the protein and the CATR molecule.
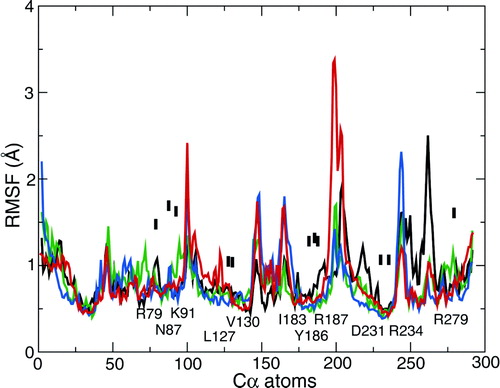
Figure S3. Conformational drift of the transmembrane helices of three domains, for simulations: (A) 1OKC, (B) 1OKC-W, (C) 1OKC-CATR, and (D) 1OKC-CATR-W RMSDs. In each case the Cα RMSD of the domain is shown as a function of time, relative to the initial structure of that domain. Black = D1, red = D2, and green = D3.
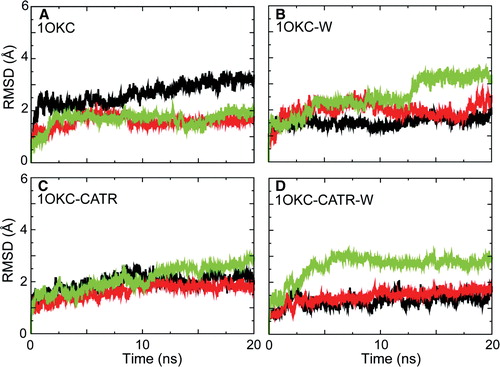
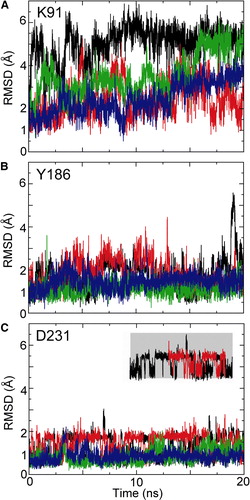
Figure S4. RMSDs of key CATR-binding sidechains, in each case for simulations 1OKC (black), 1OKC-W (red), 1OKC-CATR (green), and 1OKC-CATR-W (blue). The inset indicates two states observed for the sidechain of D231.