822
Views
22
CrossRef citations to date
0
Altmetric
Papers

The effects of α-synuclein on phospholipid vesicle integrity: a study using 31P NMR and electron microscopy

, , &
Pages 518-527 | Received 09 Jun 2008, Published online: 09 Jul 2009

Figures & data

Figure 1.  An assay using 31P MAS NMR to investigate the effects of asyn on the permeability of phospholipid vesicles. The spectrum of SUVs of DMPC/DOPG at a 2:1 molar ratio shows peaks from the two lipid components on the inside (PCi, PGi) and outside (PCo, PGo) of the vesicles (top). Addition of Mn2 +  to the vesicles selectively broadens the peaks from the exposed lipids on the vesicle exterior leaving visible only the peaks from the interior lipids (middle). Subsequent addition of Triton-X100 breaks open the vesicles, which exposes both leaflets of the bilayer to Mn2 +  and no signal is observed (bottom).
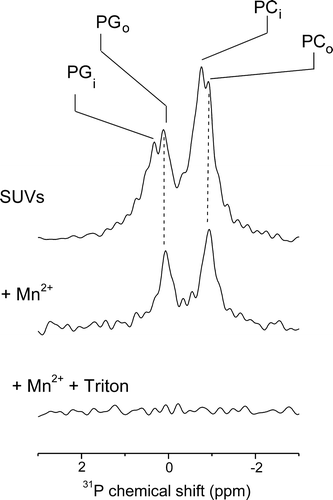
Figure 1.  An assay using 31P MAS NMR to investigate the effects of asyn on the permeability of phospholipid vesicles. The spectrum of SUVs of DMPC/DOPG at a 2:1 molar ratio shows peaks from the two lipid components on the inside (PCi, PGi) and outside (PCo, PGo) of the vesicles (top). Addition of Mn2 +  to the vesicles selectively broadens the peaks from the exposed lipids on the vesicle exterior leaving visible only the peaks from the interior lipids (middle). Subsequent addition of Triton-X100 breaks open the vesicles, which exposes both leaflets of the bilayer to Mn2 +  and no signal is observed (bottom).

Figure 2.  Results of 31P MAS NMR experiments to investigate the effects of asyn on the permeability of phospholipid vesicles. Spectra of initially intact SUVs composed of DOPC/DOPG, DMPC/DOPG, DOPC, DMPC and LUVs of DMPC/DOPG, after addition of Mn2 +  are shown before (left) and after (right) the addition of asyn to a lipid/protein molar ratio of 1 000:1 (a). The signal observed after the addition of protein is a measure of the amount of intact vesicles remaining. Figure b, summarizes the 31P signal intensity remaining after the addition of Mn2 +  and asyn to lipid/protein molar ratios 2 000:1, 1 000:1, 900:1 and 800:1 of various phospholipid compositions as shown. Intensity values are scaled with lipid alone equal to 1. All experiments were performed at 30°C.
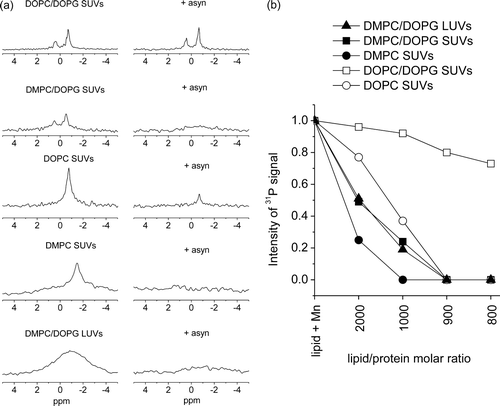
Figure 2.  Results of 31P MAS NMR experiments to investigate the effects of asyn on the permeability of phospholipid vesicles. Spectra of initially intact SUVs composed of DOPC/DOPG, DMPC/DOPG, DOPC, DMPC and LUVs of DMPC/DOPG, after addition of Mn2 +  are shown before (left) and after (right) the addition of asyn to a lipid/protein molar ratio of 1 000:1 (a). The signal observed after the addition of protein is a measure of the amount of intact vesicles remaining. Figure b, summarizes the 31P signal intensity remaining after the addition of Mn2 +  and asyn to lipid/protein molar ratios 2 000:1, 1 000:1, 900:1 and 800:1 of various phospholipid compositions as shown. Intensity values are scaled with lipid alone equal to 1. All experiments were performed at 30°C.

Figure 3.  Investigation of the association of asyn peptide fragments with phospholipid vesicles. Spectra of initially intact vesicles after addition of Mn2 +  are shown before (left) and after (right) the addition of asyn(10–48), asyn(71–82) or asyn(120–140) at a lipid/peptide molar ratio of 25:1. As above, the signal observed after the addition of peptide is a measure of the amount of intact vesicles remaining.
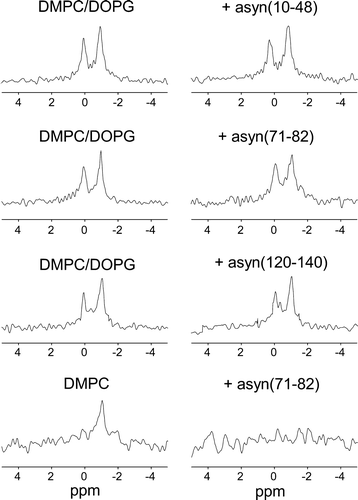
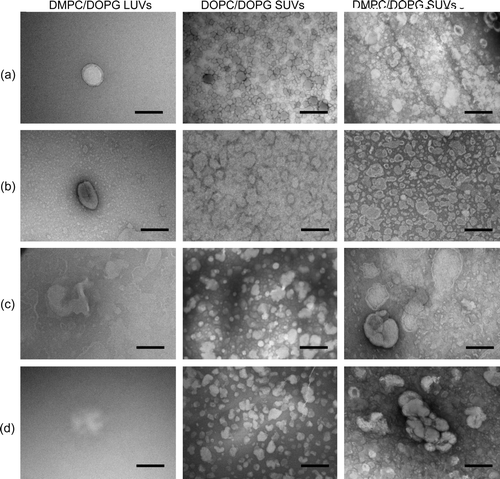
Figure 3.  Investigation of the association of asyn peptide fragments with phospholipid vesicles. Spectra of initially intact vesicles after addition of Mn2 +  are shown before (left) and after (right) the addition of asyn(10–48), asyn(71–82) or asyn(120–140) at a lipid/peptide molar ratio of 25:1. As above, the signal observed after the addition of peptide is a measure of the amount of intact vesicles remaining.
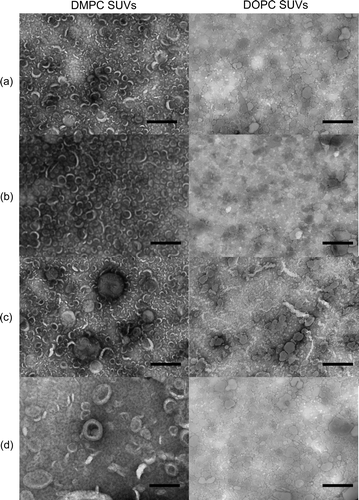
Figure 4.  EM images of mixed phospholipid vesicles alone (a), upon addition of Mn2 +  (b), in the presence of asyn and Mn2 +  (c), and in the presence of asyn with 1 mM EDTA (d). Lipid/protein molar ratios; 1000:1. Scale bars 200 nm.

Figure 4.  EM images of mixed phospholipid vesicles alone (a), upon addition of Mn2 +  (b), in the presence of asyn and Mn2 +  (c), and in the presence of asyn with 1 mM EDTA (d). Lipid/protein molar ratios; 1000:1. Scale bars 200 nm.

Figure 5.  EM images of zwitterionic phospholipid vesicles alone (a), upon addition of Mn2 +  (b), in the presence of asyn and Mn2 +  (c), and in the presence of asyn with 1 mM EDTA (d). Lipid/protein molar ratios; 1 000:1. Scale bars 200 nm.

Figure 5.  EM images of zwitterionic phospholipid vesicles alone (a), upon addition of Mn2 +  (b), in the presence of asyn and Mn2 +  (c), and in the presence of asyn with 1 mM EDTA (d). Lipid/protein molar ratios; 1 000:1. Scale bars 200 nm.

Reprints and Corporate Permissions

Please note: Selecting permissions does not provide access to the full text of the article, please see our help page How do I view content?

To request a reprint or corporate permissions for this article, please click on the relevant link below:

Academic Permissions

Please note: Selecting permissions does not provide access to the full text of the article, please see our help page How do I view content?

Obtain permissions instantly via Rightslink by clicking on the button below:

If you are unable to obtain permissions via Rightslink, please complete and submit this Permissions form. For more information, please visit our Permissions help page.