Figures & data
Table I. Primer sequences used in the construction of expression plasmids.
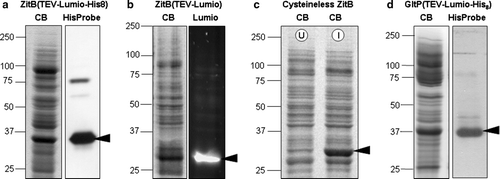
Figure 1. Expression levels and tag-based detection of over-expressed proteins in membrane samples. SDS-PAGE fractionation of membrane samples with detection of protein by Coomassie blue staining (CB); biarsenical detection of fluorescence due to the Lumio™ tag (Lumio); India™ probe detection of His8 tag (His-tag). In each case the arrowhead indicates the protein of interest. (a) ZitB(TEV-Lumio™-His8) with detection of the His8 tag; (b) ZitB(TEV-Lumio™) with detection of the Lumio tag; (c) Cysteineless ZitB carrying the mutations C230S, C294S, C299S and lacking the Lumio™-tag shown by Coomassie staining of protein in IPTG induced (I) compared with an uninduced (U) control; (d) GltP(TEV-Lumio™-His8) with detection of the His-tag. In all cases substantial bands are visible in the Coomassie blue stained gel indicating good over-expression of protein.

Figure 2. 113Cd CP-MAS analysis of membranes from E. coli expressing the zinc transporter ZitB(TEV-Lumio™-His8). (a) 113Cd CP-MAS spectrum upon incubation with 5 mM [113Cd]CdCl2 and (b) following preincubation with 50 mM ZnCl2. Spectra were recorded at 66.4 MHz for 113Cd using a MAS frequency 2.4 kHz, CP contact time 7 msec and acquisition delay 1 sec over 28 000 scans at a temperature of 4°C.
![Figure 2. 113Cd CP-MAS analysis of membranes from E. coli expressing the zinc transporter ZitB(TEV-Lumio™-His8). (a) 113Cd CP-MAS spectrum upon incubation with 5 mM [113Cd]CdCl2 and (b) following preincubation with 50 mM ZnCl2. Spectra were recorded at 66.4 MHz for 113Cd using a MAS frequency 2.4 kHz, CP contact time 7 msec and acquisition delay 1 sec over 28 000 scans at a temperature of 4°C.](/cms/asset/4427ec6d-15c4-4caa-bd82-1d3333b5f140/imbc_a_349694_f0002_b.gif)
Figure 3. 113Cd CP-MAS analysis of E. coli membranes. 113Cd CP-MAS spectra were obtained by incubation of 5 mM [113Cd]CdCl2 with E. coli membranes containing ZitB(TEV-Lumio™) before (a) and after (b) incubation with 50 mM ZnCl2 or containing cysteineless ZitB (no tag) before (c) and after (d) incubation with 50 mM ZnCl2 or containing (e) GltP(His8). NMR conditions as in .
![Figure 3. 113Cd CP-MAS analysis of E. coli membranes. 113Cd CP-MAS spectra were obtained by incubation of 5 mM [113Cd]CdCl2 with E. coli membranes containing ZitB(TEV-Lumio™) before (a) and after (b) incubation with 50 mM ZnCl2 or containing cysteineless ZitB (no tag) before (c) and after (d) incubation with 50 mM ZnCl2 or containing (e) GltP(His8). NMR conditions as in Figure 2.](/cms/asset/fc3577a4-bbce-4d1a-a7d9-f89897a7685b/imbc_a_349694_f0003_b.gif)
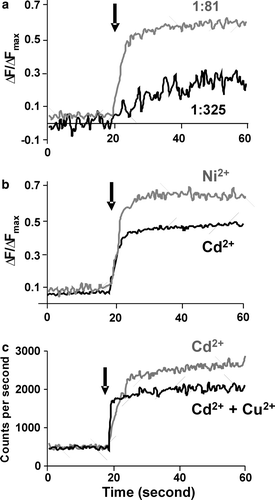
Figure 4. Transport of metal ions by reconstituted ZitB. Changes in Fluozin-1 fluorescence on metal ion addition (arrow) to proteoliposomes compared with control liposomes. ΔF/ΔFmax is relative fluorescence change normalized to maximum fluorescence on proteoliposome dissolution. (a) Zn2 + transport into proteoliposomes at 1:325 (w/w) and 1:81 (w/w) ratio of ZitB to lipid. For (b) and (c) a 1:81 ratio was used. (b) Ni2 + and Cd2 + transport into proteoliposomes (c) competition assay showing that Cu2 + ions inhibit the transport of Cd2 + ions.
