Figures & data
Figure 1. MPSI PIMS usage statistic June 2006–June 2008. The number of MPSI scientists’ visits (white column) and the number of sites (black column) which accessed the PIMS per month.
Figure 2. The PIMS protocol view. The screenshot of the PIMS protocol displaying the transformation protocol. Input, output samples and parameters are shown. Please note that due to lack of space not all the parameters of this protocol are shown. The lacking parameters are the (a) temperature of heat shock, (b) time of pre-incubation on ice, (c) time of regeneration after shock on ice, (d) whether culture was shaken (Yes/No). The dustbin icon permits deleting of the parameters and samples. This Figure is reproduced in colour in the online version of Molecular Membrane Biology.
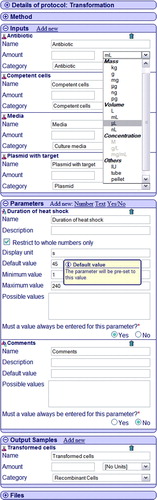
Figure 3. Chain of experiments in the PIMS, starting from fermenter culture preparation through production scale expression to membrane extraction. Experiments are displayed as ellipses with the experiment type, the samples, are represented by a trapezium displaying the sample name; arrows indicate the order of the experiments in the series. For simplicity and due to space limitations some input and output samples were not defined. This Figure is reproduced in colour in the online version of Molecular Membrane Biology.
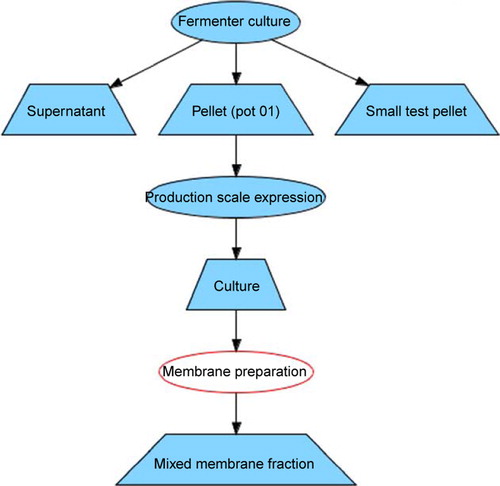
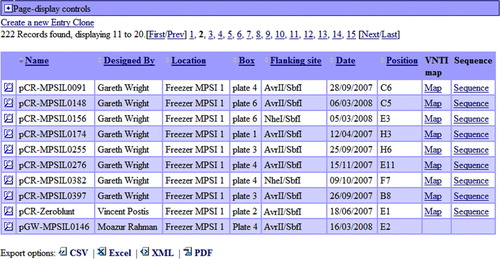
Figure 4. List of an entry clones (gateway vectors). List of entry clones containing information on the MPSI entry clones, whom they were designed by, where they can be found, when they were made, which restriction sites can be used for re-cloning the gene of interests to the expression vector. The magnifying glass icon in the left column leads to the detailed view of the record. The ‘Map’ link leads to the genbank formatted vector with inserted gene map file. Genbank file contains comments embedded by Vector NTI software used by MPSI laboratories, so that the map of the vector with inserted gene of interest can be readily visualized. The records in the columns can be sorted by Name, Designed By, Location, Box, Flanking site, Date, Position in the box. The sequence link leads to the sequence of the vector. Four exporting options are available: CVS, MS Excel, XML and PDF. This Figure is reproduced in colour in the online version of Molecular Membrane Biology.