Figures & data
Table I. Expression of membrane transport proteins in microwell plates using optimized auto-induction conditions.
Figure 1. Time course of membrane protein expression by auto-induction in a 30 L fermenter without control of pH or DO2. Fermentation of a culture harbouring target 0004A was performed using LBauto medium and samples were analysed as detailed in Materials and methods. DO2 values (•••••••••) were measured using an in-built probe. Samples were taken for measurement of D600nm (•), glucose (□) and lactose (▵) concentrations. The latter are expressed as percentages of their initial values, which were 0.5 g l−1 and 2 g l−1, respectively. The inset shows a western blot of samples of the culture taken at the indicated times (h), stained with an antibody against the hexahistidine tag of the target.
Figure 2. Screening of auto-induction culture conditions to optimize membrane protein expression. (A) Western blots, stained with an antibody against the hexahistidine tag of the targets, showing the effects of varying the concentrations of nutrients on the expression levels for three targets cultured for 28 h in deep-well plates using the indicated base media. The concentrations of glucose, glycerol and lactose used for each individual well are given as multiples of the ‘standard’ concentrations of 0.05%, 0.5% and 0.2%, respectively. (B) Contour plots showing average concentrations of glucose, lactose and glycerol yielding highest levels of expression for target protein constructs 0278E, 0294C and 0550A, following auto-induction in SBauto medium.
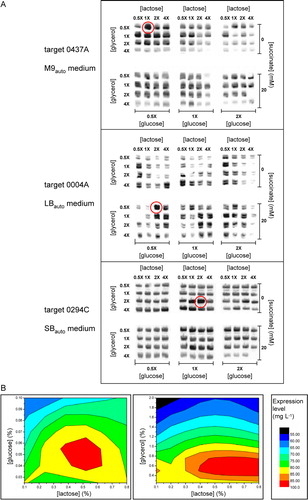
Figure 3. Comparison of peak expression levels for three targets following induction of expression by IPTG or auto-induction in 400 ml shake-flask cultures, or by auto-induction in 750 ml fermentation cultures with or without control of pH and DO2. For auto-induction, cells were cultured in the indicated media containing the ‘standard’ glucose, glycerol and lactose concentrations of 0.05%, 0.5% and 0.2% respectively, as detailed in Materials and methods. Equal volumes of culture in each case were resolved by SDS-PAGE and a western blot of the gel was stained with an antibody against the hexahistidine tag of the targets.
Figure 4. Time courses for protein expression by auto-induction in 750 ml fermentation cultures. (A) Target construct 0004A, in LBauto medium; (B) target construct 0294C, in SBauto medium; (C) target construct 0437C, in M9auto medium; (D) target construct 0356A in M9auto medium. In each case, the concentrations of glucose, glycerol, lactose and succinate were the optimal ones listed in . Fermentation was performed using control of both pH and DO2, as detailed in Materials and methods. D600nm values were measured using an in-dwelling probe and so are expressed in arbitrary units. Insets show western blots of equal volumes of culture taken at the indicated times and stained with an antibody against the hexahistidine tag of the targets. In (D), auto-induction expression of target construct 0356A was compared in host strains BL21 Star™ (DE3) and BL21 Star™ (DE3) harbouring plasmid pRARE2, cultured in the absence (––––) and presence (----) of chloramphenicol (cam; 30 µg/ml) respectively. In this case, the insets show western blot results only for the times of peak expression in the absence and presence of chloramphenicol, which were 19 h and 25 h, respectively.
Table II. Comparison of target yields following auto-induction of expression in shake-flask and fermenter cultures