680
Views
18
CrossRef citations to date
0
Altmetric
Papers

The effect of dolichol on the structure and phase behaviour of phospholipid model membranes

, &
Pages 547-556 | Received 08 Aug 2008, Published online: 09 Jul 2009

Figures & data

Figure 1.  Differential scanning calorimetric heating (a), cooling (b) thermograms of dipalmitoylphosphatidylcholine codispersed with dolichol C95. The proportion of dolichol C95 (mol%) in the phospholipid dispersion is indicated on the respective scan.
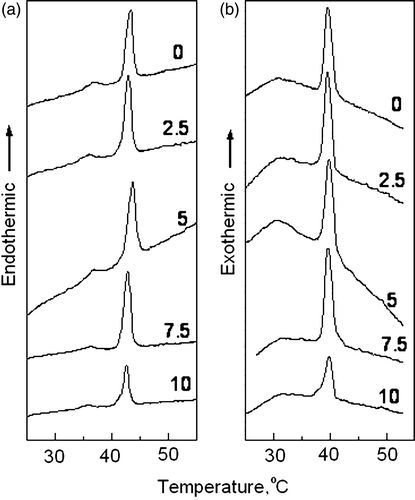
Figure 1.  Differential scanning calorimetric heating (a), cooling (b) thermograms of dipalmitoylphosphatidylcholine codispersed with dolichol C95. The proportion of dolichol C95 (mol%) in the phospholipid dispersion is indicated on the respective scan.

Figure 2.  Plots of successive small-angle X-ray scattering intensity profiles versus reciprocal spacing recorded of a fully hydrated dispersion of dipalmitoylphosphatidylcholine (a) and a codispersion of 10 mol% dolichol C95 in dipalmitoylphosphatidylcholine (b) recorded during a heating scan at 2°/min. Each diffraction pattern represents scattering accumulated in 7 seconds.
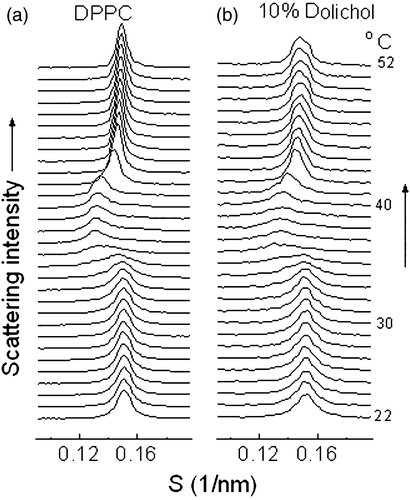
Figure 2.  Plots of successive small-angle X-ray scattering intensity profiles versus reciprocal spacing recorded of a fully hydrated dispersion of dipalmitoylphosphatidylcholine (a) and a codispersion of 10 mol% dolichol C95 in dipalmitoylphosphatidylcholine (b) recorded during a heating scan at 2°/min. Each diffraction pattern represents scattering accumulated in 7 seconds.

Figure 3.  (A) Bilayer repeat spacing versus temperature during heating scans of mixed aqueous dispersions of dipalmitoylphosphatidylcholine containing different proportions of dolichol C95. The proportion of dolichol C95 (mol%) in the phospholipid is indicated on the respective curves. (B) Relative electron density distribution across the lamellar repeat of dispersions of dipalmitoylphosphatidylcholine without and with 7.5 mol% dolichol C95 at 22°C. (C) Wide-angle X-ray scattering intensity profiles recorded at 22°C from aqueous dispersions of DPPC and DPPC containing indicated proportions of dolichol C95.

Figure 3.  (A) Bilayer repeat spacing versus temperature during heating scans of mixed aqueous dispersions of dipalmitoylphosphatidylcholine containing different proportions of dolichol C95. The proportion of dolichol C95 (mol%) in the phospholipid is indicated on the respective curves. (B) Relative electron density distribution across the lamellar repeat of dispersions of dipalmitoylphosphatidylcholine without and with 7.5 mol% dolichol C95 at 22°C. (C) Wide-angle X-ray scattering intensity profiles recorded at 22°C from aqueous dispersions of DPPC and DPPC containing indicated proportions of dolichol C95.

Figure 4.  (A) Static small-angle X-ray diffraction patterns of dipalmitoylphosphatidylethanolamine containing 0, 1, 10 and 20 mol% dolichol C95 at 58°C (a) and 70°C, respectively. (B) Normalized X-ray scattering intensities of the wide-angle peaks centred at 0.43nm recorded from mixed aqueous dispersions of DPPE containing 1 (□);10 (○); 20 (Δ) mol% dolichol C95.
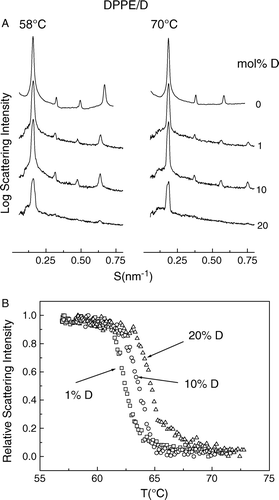
Figure 4.  (A) Static small-angle X-ray diffraction patterns of dipalmitoylphosphatidylethanolamine containing 0, 1, 10 and 20 mol% dolichol C95 at 58°C (a) and 70°C, respectively. (B) Normalized X-ray scattering intensities of the wide-angle peaks centred at 0.43nm recorded from mixed aqueous dispersions of DPPE containing 1 (□);10 (○); 20 (Δ) mol% dolichol C95.

Figure 5.  Plots of successive SAXS (a) /WAXS (b) intensity profiles at 2° intervals versus reciprocal spacing as a function of temperature of a dispersion of SOPE recorded during temperature scans at 2°/min heating from 20–70°C. SAXS (c) /WAXS (d) intensity profiles recorded from a codispersion of 1 mol% dolichol C95 in SOPE during an identical heating scan from 20–74°C. Each diffraction pattern represents scattering accumulated in 5 seconds.
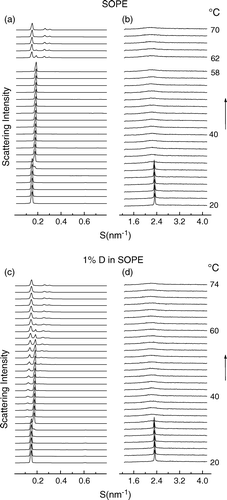
Figure 5.  Plots of successive SAXS (a) /WAXS (b) intensity profiles at 2° intervals versus reciprocal spacing as a function of temperature of a dispersion of SOPE recorded during temperature scans at 2°/min heating from 20–70°C. SAXS (c) /WAXS (d) intensity profiles recorded from a codispersion of 1 mol% dolichol C95 in SOPE during an identical heating scan from 20–74°C. Each diffraction pattern represents scattering accumulated in 5 seconds.

Figure 6.  Small-angle X-ray scattering intensity patterns of mixed aqueous dispersions of SOPE containing 0; 1; 5 and 10 mol% dolichol C95 at three different temperatures. The profiles are plotted at the logarithm of intensity to emphasize the minor bands. Arrows indicate the 1/v3 and 1/v4 reflections from hexagonal-II phase.
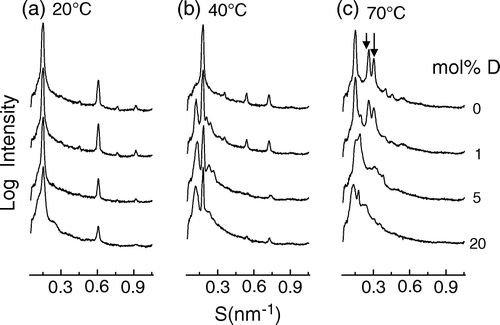
Figure 6.  Small-angle X-ray scattering intensity patterns of mixed aqueous dispersions of SOPE containing 0; 1; 5 and 10 mol% dolichol C95 at three different temperatures. The profiles are plotted at the logarithm of intensity to emphasize the minor bands. Arrows indicate the 1/v3 and 1/v4 reflections from hexagonal-II phase.

Reprints and Corporate Permissions

Please note: Selecting permissions does not provide access to the full text of the article, please see our help page How do I view content?

To request a reprint or corporate permissions for this article, please click on the relevant link below:

Academic Permissions

Please note: Selecting permissions does not provide access to the full text of the article, please see our help page How do I view content?

Obtain permissions instantly via Rightslink by clicking on the button below:

If you are unable to obtain permissions via Rightslink, please complete and submit this Permissions form. For more information, please visit our Permissions help page.