Figures & data
Figure 1. Variation in Sypro Orange fluorescence with temperature. (A) Raw fluorescence data, comparing the effect of MjCorA-2 (black line) with a control (buffer; grey line). The reaction buffer was 180 mM NaCl, 22 mM citric acid, 33 mM HEPES, and 44 mM CHES pH8. (B) First derivative (dF/dT) of the data in (A). The arrow indicates the TMP value.
Figure 2. Optimization of protein and Sypro Dye concentrations. (A) Variation in the value of first derivative fluorescence values at four different concentrations of MjCorA-2. The final assay concentration of protein used are indicated. Arrows indicate TMP values and signal strength is measured between the signal trough; t, and peak; p. (B) Variation in the value of first derivative fluorescence values at five different concentrations of Sypro Orange. The final assay concentration of MjCorA-1 used was 0.3 mg/ml in an assay volume of 50 µl. For both experiments, the reaction buffer used was 200 mM NaCl, 50 mM TrisHCl pH 8.
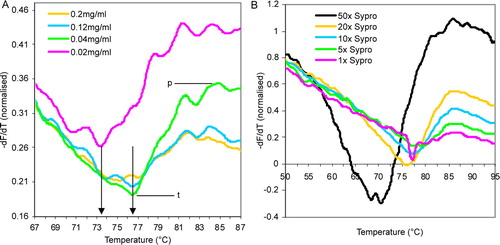
Figure 3. Spider plot of the variation in TMP of MjCorA-2 with pH and salt concentration. pH was varied using a three component buffer system containing 22 mM sodium citrate, 33 mM HEPES, and 44 mM CHES [28]. Salt concentration was varied as indicated. The radial axis shows temperature (°C) and the perimeter axis shows pH.
![Figure 3. Spider plot of the variation in TMP of MjCorA-2 with pH and salt concentration. pH was varied using a three component buffer system containing 22 mM sodium citrate, 33 mM HEPES, and 44 mM CHES [28]. Salt concentration was varied as indicated. The radial axis shows temperature (°C) and the perimeter axis shows pH.](/cms/asset/b7d56e8d-5062-4af5-83e3-f8c47e071594/imbc_a_354284_f0003_b.jpg)
Table I. Additive screen reagent concentrations and calculated TMP. Changes in melting event peak temperatures (TMP) for MjCorA-2 were calculated for each additive with respect to a no additive control. In some cases, a second unfolding event was observed which has been designated TMP2. The values marked with an asterisk gave no signal, however there is evidence the unfolding event occurred at temperatures higher than the limits of the detector. A selection of additives has been repeated in triplicate and the error has been shown to 1 standard deviation from the mean. All additives, including the no additive water control, were prepared in a final buffer concentration of 50 mM TrisHCl, 200 mM NaCl pH8.
Figure 4. Comparison of TMP for chymotrypsin-cleaved and un-cleaved MjCorA-2. pH was varied using a three component buffer system containing 22 mM sodium citrate, 33 mM HEPES, and 44 mM CHES [28] with 180 mM NaCl. Values marked by white squares gave readings off the measurable scale.
![Figure 4. Comparison of TMP for chymotrypsin-cleaved and un-cleaved MjCorA-2. pH was varied using a three component buffer system containing 22 mM sodium citrate, 33 mM HEPES, and 44 mM CHES [28] with 180 mM NaCl. Values marked by white squares gave readings off the measurable scale.](/cms/asset/7372839f-7c8b-4bd2-9e25-a30c06d9a1c1/imbc_a_354284_f0004_b.gif)
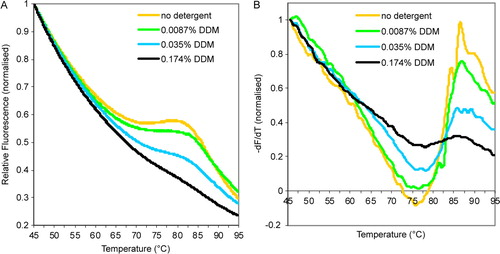
Supplementary Figure 1. The effect of free detergent concentration. (A) Raw fluorescence data of chmotrypsin-cleaved MjCorA-2, comparing the effect of four different concentrations of reaction buffer detergent. The reaction buffer was 200 mM NaCl, 50 mM Tris-HCl pH8. (B) First derivative (dF/dT) of the data in (A).
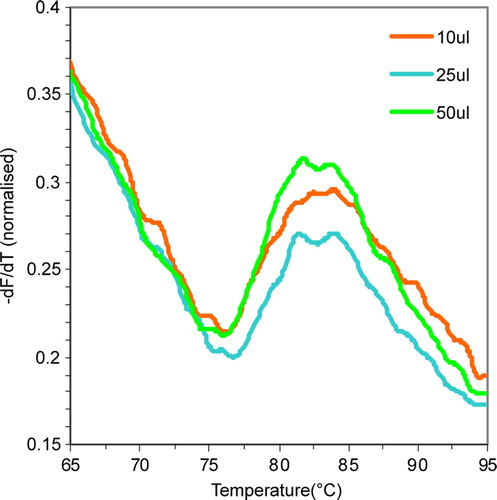
Supplementary Figure 2. The effect of experimental volume. (A) Variation in the value of first derivative fluorescence values of MjCorA-2 at three different experimental volumes. The reaction buffer was 200 mM NaCl, 50 mM Tris-HCl pH8.