Figures & data
Figure 1. Membrane topology model of the core of 10 TMSs shared by the Na+-galactose transporter vSGLT of Vibrio heamatolyticus and the Na+-leucine transporter LeuT of Aquifex aeolicus. The core consists of two domains (dashed boxes) of five TMSs each that have the same fold but opposite orientation in the membrane (inverted topology), a structural motif that is observed frequently in membrane proteins. vSGLT contains one additional TMS at the N-terminal side of the core (N) and 3 at the C-terminal side (C). LeuT contains two additional TMSs at the C-terminal side. Solid yellow boxes represent transmembrane segments. This Figure is reproduced in colour in Molecular Membrane Biology online.
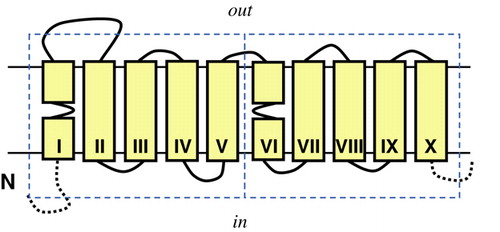
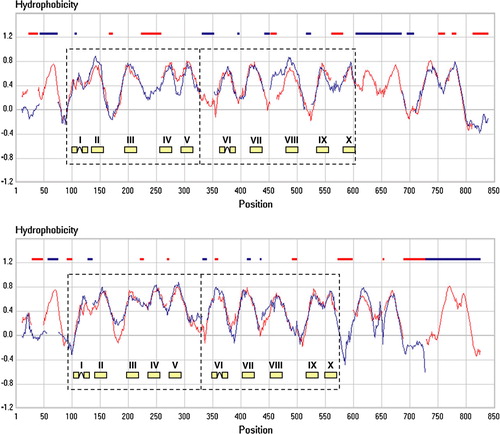
Figure 2. Hydropathy profile alignment of the SSS and NSS (top) and the SSS and AAT (bottom) families. The family hydropathy profile of the SSS family is indicated in red, those of the NSS (top) and AAT (bottom) families in blue. The AAT family is one of the families in the APC superfamily. Red and blue bars at the top indicate positions where gaps were introduced in the profiles by the alignment algorithm. Dashed boxes show the two domains in the core structure. The position of the 2 times five TMS is indicated. This Figure is reproduced in colour in Molecular Membrane Biology online.