1,976
Views
87
CrossRef citations to date
0
Altmetric
PAPERS

Expression of transient receptor potential (TRP) channels in human and murine osteoblast-like cells

, , , & , PhD
Pages 146-158 | Received 03 Jun 2008, Published online: 09 Jul 2009

Figures & data

Table I.  Sequences of the primers used for PCR amplification.

Figure 1.  Gene expression of the TRPC channels in osteoblast-like cells. Complementary DNA synthesised with total RNA isolated from human (A) or murine (B) cells was used for PCR amplifications using specific primers for each human TRPC (hTRPC) and murine TRPC (mTRPC) channels. Representative data are shown from RNA isolations of at least three independent cultures. Left lane: 100 bp ladder.
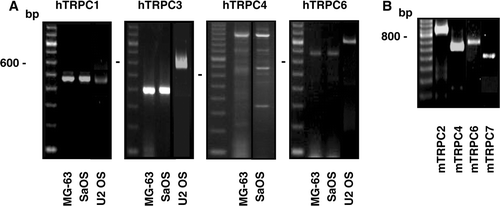
Figure 1.  Gene expression of the TRPC channels in osteoblast-like cells. Complementary DNA synthesised with total RNA isolated from human (A) or murine (B) cells was used for PCR amplifications using specific primers for each human TRPC (hTRPC) and murine TRPC (mTRPC) channels. Representative data are shown from RNA isolations of at least three independent cultures. Left lane: 100 bp ladder.
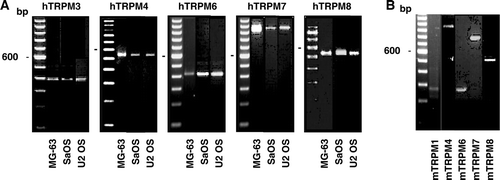
Figure 2.  Gene expression of the TRPM channels in osteoblast-like cells. Total RNA isolated from human (A) or murine (B) cells was used to synthesize complementary DNA for PCR amplifications using specific primers for each human TRPM (hTRPM) or murine TRPM (mTRPM) channels. Representative data are shown from RNA isolations of at least three independent cultures. Left lane: 100 bp ladder.
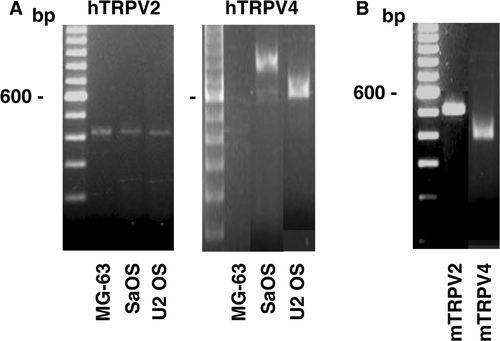
Figure 2.  Gene expression of the TRPM channels in osteoblast-like cells. Total RNA isolated from human (A) or murine (B) cells was used to synthesize complementary DNA for PCR amplifications using specific primers for each human TRPM (hTRPM) or murine TRPM (mTRPM) channels. Representative data are shown from RNA isolations of at least three independent cultures. Left lane: 100 bp ladder.

Figure 3.  Gene expression of the TRPV channels in osteoblast-like cells. Complementary DNA synthesised with total RNA isolated from human (A) or murine (B) cells was used for PCR amplifications using specific primers for human TRPV (hTRPV) or murine TRPV (mTRPV) channels. Representative data are shown from RNA isolations of at least three independent cultures. Left lane: 100 bp ladder.

Figure 3.  Gene expression of the TRPV channels in osteoblast-like cells. Complementary DNA synthesised with total RNA isolated from human (A) or murine (B) cells was used for PCR amplifications using specific primers for human TRPV (hTRPV) or murine TRPV (mTRPV) channels. Representative data are shown from RNA isolations of at least three independent cultures. Left lane: 100 bp ladder.

Figure 4.  Induction of capacitative calcium entry in osteoblastic MC3T3 cells. Fluo3-loaded MC3T3 cells without or with pre-incubation with 30 µM SKF96365 for 15 min were treated with 5 µM thapsigargine (Tg) in Ca2+-free HEPES-buffered saline solution. After Tg-mediated intracellular Ca2+ release, Ca2+ was added (right arrow, final concentration of 1.8 mM) to the buffer alone. Each response is expressed as the mean ± SEM of the relative fluorescence intensity from at least three experiments with cumulating analysis of between 30 and 40 cells per field.
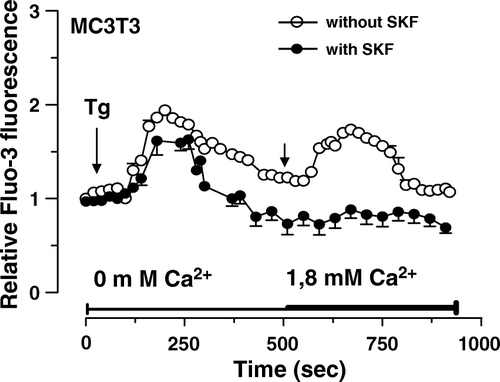
Figure 4.  Induction of capacitative calcium entry in osteoblastic MC3T3 cells. Fluo3-loaded MC3T3 cells without or with pre-incubation with 30 µM SKF96365 for 15 min were treated with 5 µM thapsigargine (Tg) in Ca2+-free HEPES-buffered saline solution. After Tg-mediated intracellular Ca2+ release, Ca2+ was added (right arrow, final concentration of 1.8 mM) to the buffer alone. Each response is expressed as the mean ± SEM of the relative fluorescence intensity from at least three experiments with cumulating analysis of between 30 and 40 cells per field.

Figure 5.  Effect of the TRPC inhibitor SKF96365 on osteoblastic cell proliferation. MG-63 (A), SaOS (B) and U2 OS (C) osteoblasts were cultured for 48 h in DMEM-F12 supplemented with 10% FBS or 25 ng/ml PDGF and increasing concentrations of SKF96365. Cell proliferation was determined after 48 h by the MTT assay and data are the mean ± SEM of the cell proliferation compared to control condition in culture medium from 3–6 independent experiments. Statistical analyses were performed by ANOVA with Dunnett's post-test (p < 0.001 from 2 µM SKF96365 for MG-63 with either PDGF or FBS; p < 0.001 from 5 µM SKF96365 for SaOS with FBS; p < 0.001 from 2 µM SKF96365 for U2 OS with either PDGF or FBS)
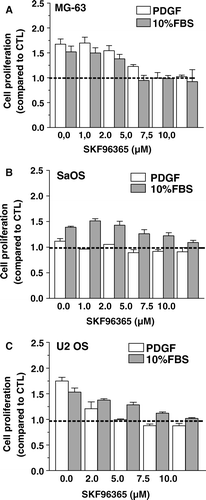
Figure 5.  Effect of the TRPC inhibitor SKF96365 on osteoblastic cell proliferation. MG-63 (A), SaOS (B) and U2 OS (C) osteoblasts were cultured for 48 h in DMEM-F12 supplemented with 10% FBS or 25 ng/ml PDGF and increasing concentrations of SKF96365. Cell proliferation was determined after 48 h by the MTT assay and data are the mean ± SEM of the cell proliferation compared to control condition in culture medium from 3–6 independent experiments. Statistical analyses were performed by ANOVA with Dunnett's post-test (p < 0.001 from 2 µM SKF96365 for MG-63 with either PDGF or FBS; p < 0.001 from 5 µM SKF96365 for SaOS with FBS; p < 0.001 from 2 µM SKF96365 for U2 OS with either PDGF or FBS)

Figure 6.  Effect of reducing TRPC3 expression on the capacitative calcium entry induced by PDGF. MG-63 cells were transfected with specific siRNAs against human TRPC3 (si-hTRPC3) or with nontargeting control siRNA (Mock). (A) The expression of human TRPC1 and TRPC3 was determined after 48 h by RT-PCR and normalized according to the expression of GAPDH for three experiments. Student's t-test: *p < 0.05 compared to Mock condition. (B) Fluo3-loaded MG-63 cells transfected for 48 h with si-hTRPC3 or non-targeting control siRNA (Mock) were treated with 25 ng/ml PDGF in Ca2+-free HEPES-buffered saline solution. After PDGF-mediated intracellular Ca2+ release, Ca2+ was added (right arrow, final concentration of 1.8 mM) to the buffer alone. Each response is expressed as the mean ± SEM of the relative fluorescence intensity from at least three experiments with cumulating analysis of between 30 and 40 cells per field.
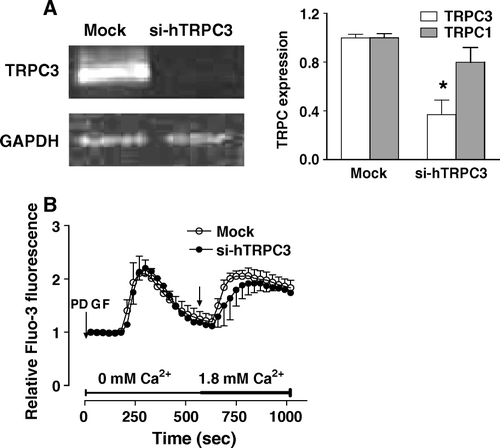
Figure 6.  Effect of reducing TRPC3 expression on the capacitative calcium entry induced by PDGF. MG-63 cells were transfected with specific siRNAs against human TRPC3 (si-hTRPC3) or with nontargeting control siRNA (Mock). (A) The expression of human TRPC1 and TRPC3 was determined after 48 h by RT-PCR and normalized according to the expression of GAPDH for three experiments. Student's t-test: *p < 0.05 compared to Mock condition. (B) Fluo3-loaded MG-63 cells transfected for 48 h with si-hTRPC3 or non-targeting control siRNA (Mock) were treated with 25 ng/ml PDGF in Ca2+-free HEPES-buffered saline solution. After PDGF-mediated intracellular Ca2+ release, Ca2+ was added (right arrow, final concentration of 1.8 mM) to the buffer alone. Each response is expressed as the mean ± SEM of the relative fluorescence intensity from at least three experiments with cumulating analysis of between 30 and 40 cells per field.

Figure 7.  Effect of reducing TRPC1 expression on the capacitative calcium entry and cell proliferation induced by PDGF. MG-63 cells were transfected with specific siRNAs against human TRPC1 (si-hTRPC1) or with nontargeting control siRNA (Mock). (A) The expression of human TRPC1 was determined after 48 h by RT-PCR and normalized according to the expression of GAPDH for three experiments. Student's t-test: *p < 0.05 compared to Mock condition. (B) Fluo3-loaded MG-63 cells transfected for 48 h with si-hTRPC1 or nontargeting control siRNA (Mock) were treated with 25 ng/ml PDGF in Ca2+-free HEPES-buffered saline solution. After PDGF-mediated intracellular Ca2+ release, Ca2+ was added (right arrow, final concentration of 1.8 mM) to the buffer alone. Each response is expressed as the mean ± SEM of the relative fluorescence intensity from at least three experiments with cumulating analysis of between 30 and 40 cells per field. Statistical analyses were performed by ANOVA with Dunnett's post-test p < 0.001. (C) The cell proliferation was determined by MTT assays on 48-h transfected cells with si-hTRPC1, non-trageting control (Mock) or in culture medium (CTL) following subsequent treatments of 48 h without or with 25 ng/ml PDGF. Data are the mean ± SEM of the cell proliferation compared to CTL without PDGF from 3–6 independent experiments. Student's t-test: ***p < 0.001 compared to CTL without PDGF, £££p < 0.001 compared to Mock with PDGF.
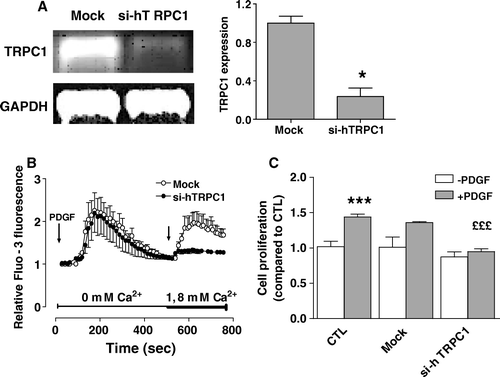
Figure 7.  Effect of reducing TRPC1 expression on the capacitative calcium entry and cell proliferation induced by PDGF. MG-63 cells were transfected with specific siRNAs against human TRPC1 (si-hTRPC1) or with nontargeting control siRNA (Mock). (A) The expression of human TRPC1 was determined after 48 h by RT-PCR and normalized according to the expression of GAPDH for three experiments. Student's t-test: *p < 0.05 compared to Mock condition. (B) Fluo3-loaded MG-63 cells transfected for 48 h with si-hTRPC1 or nontargeting control siRNA (Mock) were treated with 25 ng/ml PDGF in Ca2+-free HEPES-buffered saline solution. After PDGF-mediated intracellular Ca2+ release, Ca2+ was added (right arrow, final concentration of 1.8 mM) to the buffer alone. Each response is expressed as the mean ± SEM of the relative fluorescence intensity from at least three experiments with cumulating analysis of between 30 and 40 cells per field. Statistical analyses were performed by ANOVA with Dunnett's post-test p < 0.001. (C) The cell proliferation was determined by MTT assays on 48-h transfected cells with si-hTRPC1, non-trageting control (Mock) or in culture medium (CTL) following subsequent treatments of 48 h without or with 25 ng/ml PDGF. Data are the mean ± SEM of the cell proliferation compared to CTL without PDGF from 3–6 independent experiments. Student's t-test: ***p < 0.001 compared to CTL without PDGF, £££p < 0.001 compared to Mock with PDGF.

Figure 8.  Effect of reducing TRPM7 expression on the proliferation of osteoblasts. Cells were transfected with specific siRNAs against human TRPM7 (si-hTRPM7) or with nontargeting control siRNA (Mock). (A) The expression of human TRPM7 in U2 OS cells was determined after 48 h by RT-PCR and normalized according to the expression of GAPDH for three independent experiments. Student's t-test: ***p < 0.001 compared to Mock. (B) Cell proliferation was determined after 48 h for control cells in the culture medium alone (CTL) or for cells following 48-h transfection with nontargeting control siRNA (Mock) or with si-hTRPM7 in the absence or the presence of 25 ng/ml PDGF. Results of initial MTT values (absorbance values from cells at the initial day of treatment) are also shown. Data are expressed as the mean ± SEM of the cell proliferation compared to CTL of three independent experiments. Student's t-test analysis for U2 OS cells: *p < 0.05 compared to Mock condition, ££p < 0.001 compared to Mock condition with PDGF; MG-63 cells: ***p < 0.001 compared to Mock condition, £££p < 0.001 compared to Mock condition with PDGF.
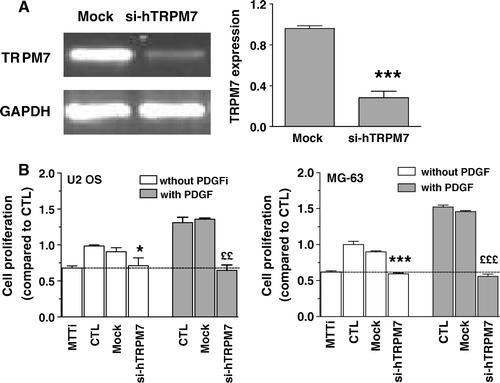
Figure 8.  Effect of reducing TRPM7 expression on the proliferation of osteoblasts. Cells were transfected with specific siRNAs against human TRPM7 (si-hTRPM7) or with nontargeting control siRNA (Mock). (A) The expression of human TRPM7 in U2 OS cells was determined after 48 h by RT-PCR and normalized according to the expression of GAPDH for three independent experiments. Student's t-test: ***p < 0.001 compared to Mock. (B) Cell proliferation was determined after 48 h for control cells in the culture medium alone (CTL) or for cells following 48-h transfection with nontargeting control siRNA (Mock) or with si-hTRPM7 in the absence or the presence of 25 ng/ml PDGF. Results of initial MTT values (absorbance values from cells at the initial day of treatment) are also shown. Data are expressed as the mean ± SEM of the cell proliferation compared to CTL of three independent experiments. Student's t-test analysis for U2 OS cells: *p < 0.05 compared to Mock condition, ££p < 0.001 compared to Mock condition with PDGF; MG-63 cells: ***p < 0.001 compared to Mock condition, £££p < 0.001 compared to Mock condition with PDGF.

Table II.  Gene expression of the TRPC channels in human and murine osteoblastic cells.

Table III.  Gene expression of the TRPM channels in human and murine osteoblastic cells.

Table IV.  Gene expression of the TRPV channels in human and murine osteoblastic cells.

Reprints and Corporate Permissions

Please note: Selecting permissions does not provide access to the full text of the article, please see our help page How do I view content?

To request a reprint or corporate permissions for this article, please click on the relevant link below:

Academic Permissions

Please note: Selecting permissions does not provide access to the full text of the article, please see our help page How do I view content?

Obtain permissions instantly via Rightslink by clicking on the button below:

If you are unable to obtain permissions via Rightslink, please complete and submit this Permissions form. For more information, please visit our Permissions help page.