447
Views
12
CrossRef citations to date
0
Altmetric
PAPERS

Morphology modifications in negatively charged lipid monolayers upon mitochondrial creatine kinase binding

, , , &
Pages 171-185 | Received 13 Jun 2008, Published online: 09 Jul 2009

Figures & data

Figure 1.  Compression of a DMPG monolayer: (a) Surface pressure-molecular area isotherm and BAM images recorded during compression; (b) Ks evolution as function of surface pressure. Lateral surface pressure in mN/m, grey level (GL) and obturation speed (OS) are indicated on each image. Subphase: 0.1 mM EDTA, 20 mM Tris HCl buffer, pH 7.4, 21°C.
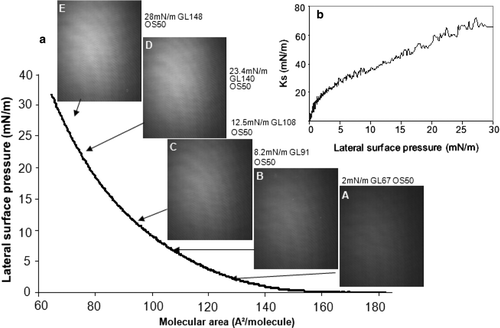
Figure 1.  Compression of a DMPG monolayer: (a) Surface pressure-molecular area isotherm and BAM images recorded during compression; (b) Ks evolution as function of surface pressure. Lateral surface pressure in mN/m, grey level (GL) and obturation speed (OS) are indicated on each image. Subphase: 0.1 mM EDTA, 20 mM Tris HCl buffer, pH 7.4, 21°C.
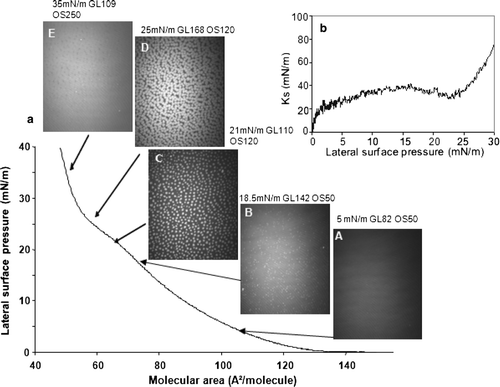
Figure 2.  Compression of a DPPG monolayer: (a) Surface pressure-molecular area isotherm and BAM images recorded during compression; (b) Ks evolution as function of surface pressure. Lateral surface pressure in mN/m, grey level (GL) and obturation speed (OS) are indicated on each image. Subphase: 0.1 mM EDTA, 20 mM Tris HCl buffer, pH 7.4, 21°C.
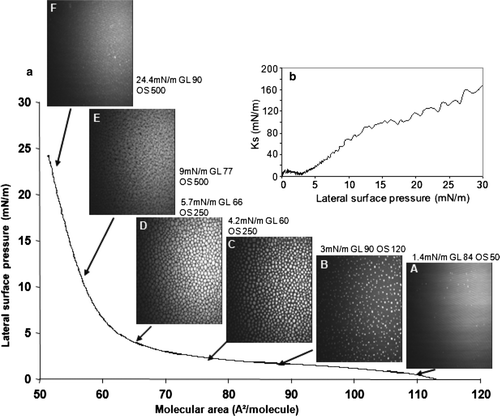
Figure 2.  Compression of a DPPG monolayer: (a) Surface pressure-molecular area isotherm and BAM images recorded during compression; (b) Ks evolution as function of surface pressure. Lateral surface pressure in mN/m, grey level (GL) and obturation speed (OS) are indicated on each image. Subphase: 0.1 mM EDTA, 20 mM Tris HCl buffer, pH 7.4, 21°C.

Figure 3.  Compression of a DSPG monolayer: (a) Surface pressure-molecular area isotherm and BAM images recorded during compression; (b) Ks evolution as function of surface pressure. Lateral surface pressure in mN/m, grey level (GL) and obturation speed (OS) are indicated on each image. Subphase: 0.1 mM EDTA, 20 mM Tris HCl buffer, pH 7.4, 21°C.

Figure 3.  Compression of a DSPG monolayer: (a) Surface pressure-molecular area isotherm and BAM images recorded during compression; (b) Ks evolution as function of surface pressure. Lateral surface pressure in mN/m, grey level (GL) and obturation speed (OS) are indicated on each image. Subphase: 0.1 mM EDTA, 20 mM Tris HCl buffer, pH 7.4, 21°C.

Figure 4.  Recompression of a DMPG monolayer in the presence or absence of mtCK (0.9 nM): (a) Pressure-area isotherms in the absence (grey, triangles) or presence (black, circles) of mtCK; (b) Ks variation during compression in the presence (black thick line) or absence (grey thin line) of mtCK. Bottom: BAM images taken during recompression of the monolayer in the absence (A–E) or presence (F–J) of mtCK. Lateral surface pressure in mN/m, grey level (GL) and obturation speed (OS) are indicated below each image. Subphase: 0.1 mM EDTA, 20 mM Tris HCl buffer, pH 7.4, 21°C.
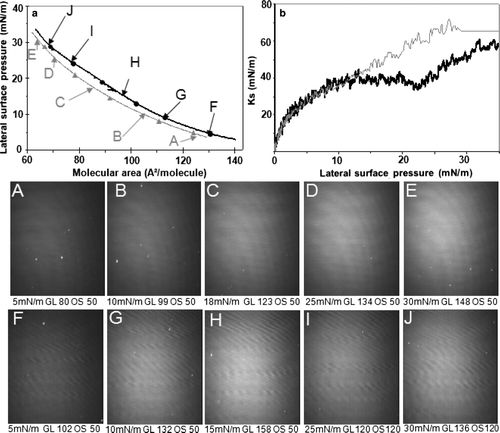
Figure 4.  Recompression of a DMPG monolayer in the presence or absence of mtCK (0.9 nM): (a) Pressure-area isotherms in the absence (grey, triangles) or presence (black, circles) of mtCK; (b) Ks variation during compression in the presence (black thick line) or absence (grey thin line) of mtCK. Bottom: BAM images taken during recompression of the monolayer in the absence (A–E) or presence (F–J) of mtCK. Lateral surface pressure in mN/m, grey level (GL) and obturation speed (OS) are indicated below each image. Subphase: 0.1 mM EDTA, 20 mM Tris HCl buffer, pH 7.4, 21°C.
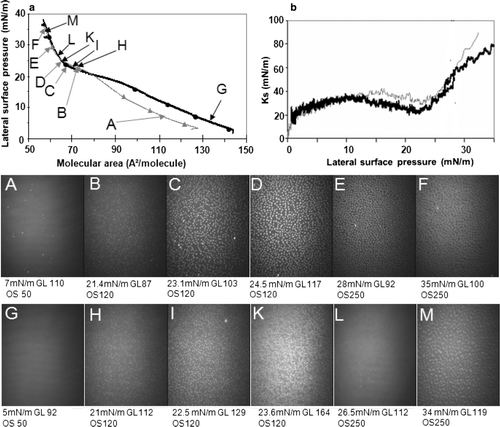
Figure 5.  Recompression of a DPPG monolayer in the absence or presence of mtCK (0.9 nM): (a) Pressure-area isotherms in the absence (grey, triangles) or presence (black, circles) of mtCK; (b) Ks variation during compression in the absence (grey thin line) or presence (black thick line) of mtCK. Bottom: BAM images taken during recompression in the absence (A–F) or presence (G–M) of protein. Lateral surface pressure in mN/m, grey level (GL) and obturation speed (OS) are indicated below each image. Subphase: 0.1 mM EDTA, 20 mM Tris HCl buffer, pH 7.4, 21°C.
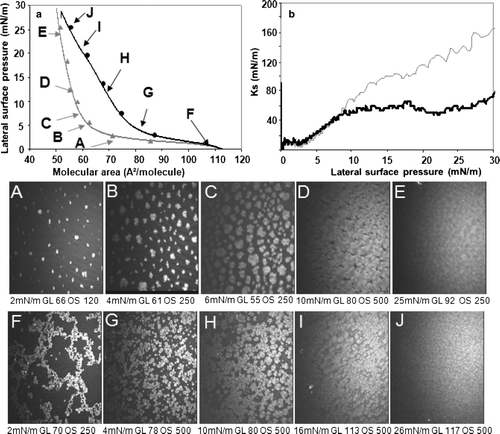
Figure 5.  Recompression of a DPPG monolayer in the absence or presence of mtCK (0.9 nM): (a) Pressure-area isotherms in the absence (grey, triangles) or presence (black, circles) of mtCK; (b) Ks variation during compression in the absence (grey thin line) or presence (black thick line) of mtCK. Bottom: BAM images taken during recompression in the absence (A–F) or presence (G–M) of protein. Lateral surface pressure in mN/m, grey level (GL) and obturation speed (OS) are indicated below each image. Subphase: 0.1 mM EDTA, 20 mM Tris HCl buffer, pH 7.4, 21°C.

Figure 6.  Recompression of a DSPG monolayer in the absence or presence of mtCK (0.9 nM): (a) Pressure-area isotherms in the absence (grey, triangles) or presence (black, circles) of mtCK; (b) Ks variation during compression in the absence (grey thin line) or presence (black thick line) of mtCK. Bottom: BAM images taken during recompression in the absence (A–E) or presence (F–J) of protein. Lateral surface pressure in mN/m, grey level (GL) and obturation speed (OS) are indicated below each image. Subphase: 0.1 mM EDTA, 20 mM Tris HCl buffer, pH 7.4, 21°C.

Figure 6.  Recompression of a DSPG monolayer in the absence or presence of mtCK (0.9 nM): (a) Pressure-area isotherms in the absence (grey, triangles) or presence (black, circles) of mtCK; (b) Ks variation during compression in the absence (grey thin line) or presence (black thick line) of mtCK. Bottom: BAM images taken during recompression in the absence (A–E) or presence (F–J) of protein. Lateral surface pressure in mN/m, grey level (GL) and obturation speed (OS) are indicated below each image. Subphase: 0.1 mM EDTA, 20 mM Tris HCl buffer, pH 7.4, 21°C.

Figure 7.  Compression of a TMCL monolayer: (a) Surface pressure-molecular area isotherm and BAM images recorded during compression; (b) Ks evolution as function of surface pressure. Lateral surface pressure in mN/m, grey level (GL) and obturation speed (OS) are indicated on each image. Subphase: 0.1 mM EDTA, 20 mM Tris HCl buffer, pH 7.4, 21°C.
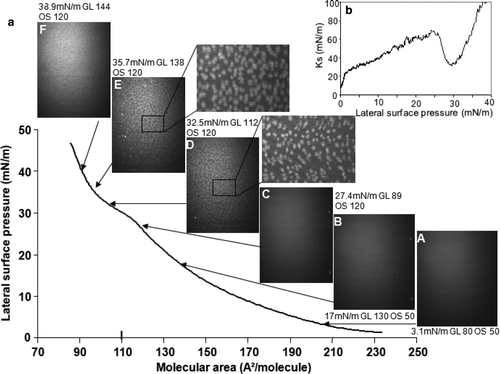
Figure 7.  Compression of a TMCL monolayer: (a) Surface pressure-molecular area isotherm and BAM images recorded during compression; (b) Ks evolution as function of surface pressure. Lateral surface pressure in mN/m, grey level (GL) and obturation speed (OS) are indicated on each image. Subphase: 0.1 mM EDTA, 20 mM Tris HCl buffer, pH 7.4, 21°C.

Figure 8.  Recompression of a TMCL monolayer in the absence or presence of mtCK (0.9 nM): (a) Pressure-area isotherms in the absence (grey, triangles) or presence (black, circles) of mtCK; (b) Ks variation during compression in the absence (grey thin line) or presence (black thick line) of mtCK. Bottom: BAM images taken during recompression in the absence (A–E) or presence (F–J) of protein. Lateral surface pressure in mN/m, grey level (GL) and obturation speed (OS) are indicated below each image. Subphase: 0.1 mM EDTA, 20 mM Tris HCl buffer, pH 7.4, 21°C.
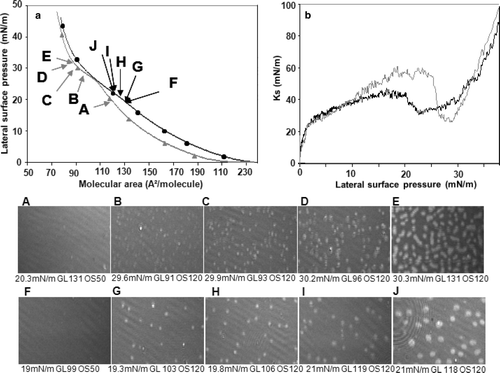
Figure 8.  Recompression of a TMCL monolayer in the absence or presence of mtCK (0.9 nM): (a) Pressure-area isotherms in the absence (grey, triangles) or presence (black, circles) of mtCK; (b) Ks variation during compression in the absence (grey thin line) or presence (black thick line) of mtCK. Bottom: BAM images taken during recompression in the absence (A–E) or presence (F–J) of protein. Lateral surface pressure in mN/m, grey level (GL) and obturation speed (OS) are indicated below each image. Subphase: 0.1 mM EDTA, 20 mM Tris HCl buffer, pH 7.4, 21°C.

Figure 9.  Evolution of the lateral surface pressure and of the aspect of the interfacial film after injection of 4 nM mtCK (large arrows) beneath TMCL monolayers spread on 0.1 mM EDTA, 20 mM Tris HCl buffer subphase (pH 7.4) in different condensation states: (a) LE; (b) LE-LC mixture; (c) LC. Lateral surface pressure in mN/m, grey level (GL), obturation speed (OS) and average film thickness in nm are indicated below each image. Experiments were performed at 21°C.
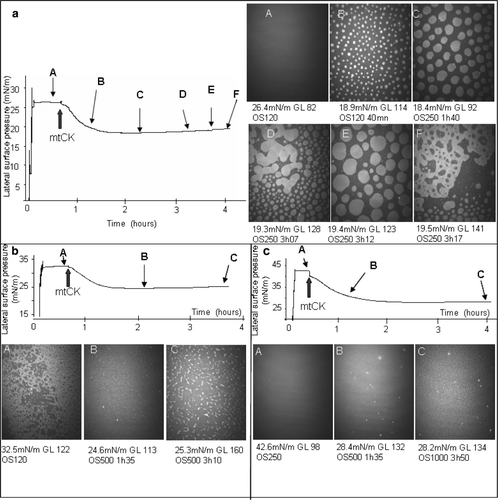
Figure 9.  Evolution of the lateral surface pressure and of the aspect of the interfacial film after injection of 4 nM mtCK (large arrows) beneath TMCL monolayers spread on 0.1 mM EDTA, 20 mM Tris HCl buffer subphase (pH 7.4) in different condensation states: (a) LE; (b) LE-LC mixture; (c) LC. Lateral surface pressure in mN/m, grey level (GL), obturation speed (OS) and average film thickness in nm are indicated below each image. Experiments were performed at 21°C.

Reprints and Corporate Permissions

Please note: Selecting permissions does not provide access to the full text of the article, please see our help page How do I view content?

To request a reprint or corporate permissions for this article, please click on the relevant link below:

Academic Permissions

Please note: Selecting permissions does not provide access to the full text of the article, please see our help page How do I view content?

Obtain permissions instantly via Rightslink by clicking on the button below:

If you are unable to obtain permissions via Rightslink, please complete and submit this Permissions form. For more information, please visit our Permissions help page.