Figures & data
Figure 1. The Cα trace of PagP (grey) with selected residues shown in bonds format in green (Trp, Tyr) or blue (Arg, Lys) leaflet residues. The selected residues are those which form hydrogen bond to DMPC for >30% of simulation Sim1. This figure is reproduced in colour in Molecular Membrane Biology online.
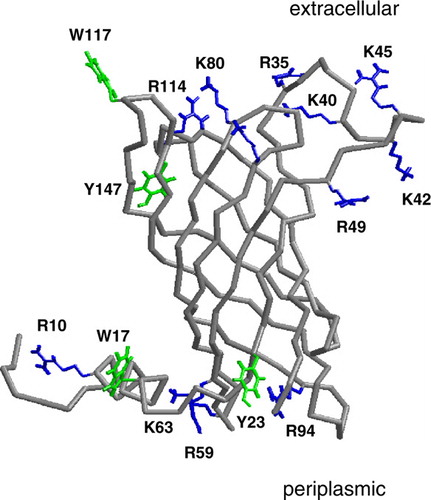
Table I. Simulations.
Figure 2. Cα atom root mean square fluctuations (RMSFs) vs. residue number compared between simulations. RMSFs were calculated over the final 10 ns of each simulation: (A) X-ray structure: micelle vs. bilayer, i.e. simulations Sim1, Sim5 and Sim6. (B) NMR structure: micelle vs. bilayer, i.e. simulations Sim7, Sim8 and Sim9. The black lines correspond to the DPC micelle simulations; the grey lines to the OG micelle simulations; and the red lines to the DMPC bilayer simulations. (C) RMSF vs. residue profiles for the different bilayer simulations of the X-ray structure (Sim1 to Sim4). The red line corresponds to the DMPC simulation (Sim1); green to the POPC simulation (Sim2); orange to DPPC (Sim3); blue to the POPG/POPE simulation (Sim4). Note that in this graph and the associated discussion in the text, L1 to L4 correspond to the four extracellular loops, T1 corresponds to the turn linking the N-terminal α-helix to the first β-strand, and T2 to T4 correspond to the periplasmic turns linking β2 to β3 etc. This figure is reproduced in colour in Molecular Membrane Biology online.
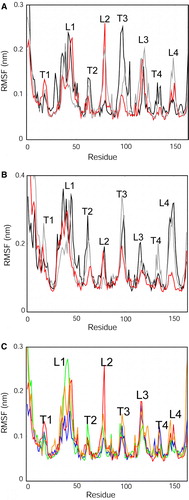
Figure 3. Numbers of contacts (defined using a 0.3 nm cut-off) by PagP to lipid/detergent molecules. The analysis is divided into lipid/detergent headgroups and tails. (A) X-ray structure: micelle vs. bilayer simulations, Sim1 (DMPC; red), Sim5 (DPC; black) and Sim6 (OG, grey). (B) NMR structure: micelle vs. bilayer simulations, Sim7 (DMPC, red), Sim8 (DPC, black) and Sim9 (OG, grey). This figure is reproduced in colour in Molecular Membrane Biology online.
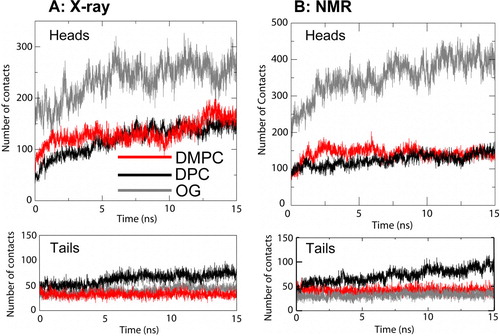
Figure 4. (A) Number of contacts from PagP to the detergent/lipid headgroups as a function of time and z coordinate for Sim7 (NMR, DMPC), Sim8 (NMR, DPC) and Sim9 (NMR, OG). Note that a negative z coordinate corresponds to the periplasmic end and a positive z coordinate to the extracellular end of PagP. (B) Snapshots taken from Sim7 (NMR, DMPC) showing the movement of the amphipathic helix towards the bilayer interface. (C) Number of hydrogen bonds between the amphipathic helix and the lipid molecules as a function of time for Sim7. This figure is reproduced in colour in Molecular Membrane Biology online.
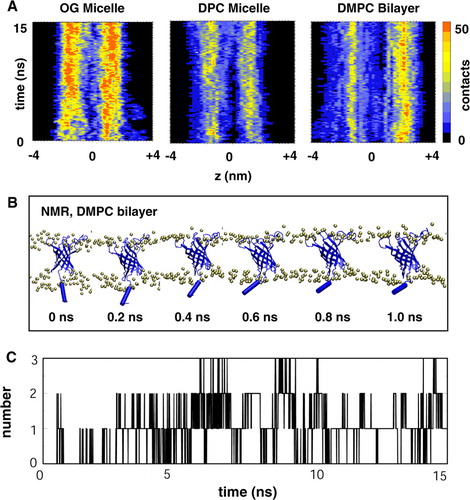
Figure 5. Snapshots from (A) Sim8 (NMR, DPC) showing movement of DPC detergent molecules into mouth of the binding pocket and from (B) Sim9 (NMR, OG), showing movement of OG detergent molecules into mouth of the binding pocket. This figure is reproduced in colour in Molecular Membrane Biology online.
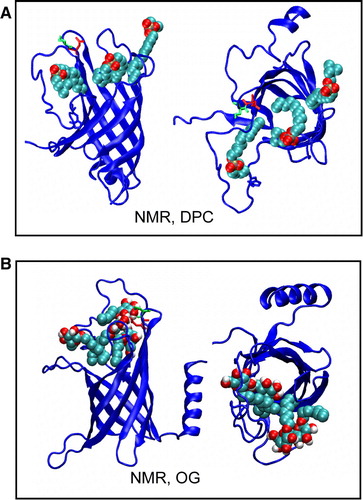
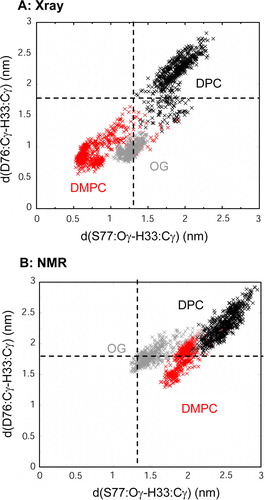
Figure 6. Scatter plot of the potential active site geometry as defined by the pair of distances: (i) from D76 Cγ to H33 Cγ; and (ii) from S77 Oγ to H33 Cγ. Distances were measured every 0.025 ns. (A) X-ray structure: micelle vs. bilayer simulations, i.e. Sim1 (DMPC, red), Sim5 (DPC, black) and Sim6 (OG, grey); (B) NMR structure: micelle vs. bilayer simulations, i.e. Sim7 (DMPC, red), Sim8 (DPC, black) and Sim9 (OG, grey). The broken horizontal and vertical lines represent the corresponding pair of distances in the X-ray structure (i.e. 1THQ). This figure is reproduced in colour in Molecular Membrane Biology online.