Figures & data
Figure 1. Structural and phylogenetic relationship between the human aquaporins. (A) Snake-plot of human aquaporin 1 showing similar (red), conserved (blue), and invariable (purple) residues among all the human aquaporins. Polar residues (yellow) refer to the three residues pointed out to be important for folding path and tetramer stability, which when mutated caused a considerably increase in hAQP4 production. The plot was made using TEXshade and TEXtopo Citation[57], Citation[58]. (B) Phylogenetic tree representing all 13 human aquaporins where aquaporins giving a high protein yield (green boxes) and a yield below the detection limit (red boxes), respectively, are marked. The sequences were aligned using ClustalW2 (http://www.ebi.ac.uk/Tools/clustalw2/) and the tree generated using the TreeViewX v.0.5 program. This Figure is reproduced in colour in Molecular Membrane Biology online.
![Figure 1. Structural and phylogenetic relationship between the human aquaporins. (A) Snake-plot of human aquaporin 1 showing similar (red), conserved (blue), and invariable (purple) residues among all the human aquaporins. Polar residues (yellow) refer to the three residues pointed out to be important for folding path and tetramer stability, which when mutated caused a considerably increase in hAQP4 production. The plot was made using TEXshade and TEXtopo Citation[57], Citation[58]. (B) Phylogenetic tree representing all 13 human aquaporins where aquaporins giving a high protein yield (green boxes) and a yield below the detection limit (red boxes), respectively, are marked. The sequences were aligned using ClustalW2 (http://www.ebi.ac.uk/Tools/clustalw2/) and the tree generated using the TreeViewX v.0.5 program. This Figure is reproduced in colour in Molecular Membrane Biology online.](/cms/asset/758270ac-bcde-4111-a4c0-244616059cef/imbc_a_386380_f0001_b.jpg)
Figure 2. Immunoblots showing total and membrane integrated production of hAQPs in P. pastoris. (A–D) Samples representing the total and membrane integrated production are loaded in triplicates for each hAQP produced in P. pastoris together with a production control (SoPIP2;1) and an internal scaling standard (purified hAQP1). The amount of total protein loaded for each hAQP is stated above each immunoblot. *For hAQP8, 7.5 µg is loaded in lane 3.
Figure 3. Total and membrane integrated production of hAQPs in P. pastoris. (A) Bar chart showing the total production level of the different human aquaporins produced in the host P. pastoris relative the SoPIP2;1 production (in grey), for which the production is set to one. The y-axis represents average from triplicate cultures, error bars show the standard deviation (n=3). (B) Bar chart showing the membrane localized fraction for the hAQPs produced with moderate to high yield. The typical fraction of membrane localization is also shown for the reference protein, SoPIP2;1 (grey). High values indicate that a large fraction of the overproduced protein is entering the membrane. The hAQPs are grouped by their position in the phylogenetic analysis (Figure 1B); aquaporins are blue and aquaglyceroporins are purple. This Figure is reproduced in colour in Molecular Membrane Biology online.
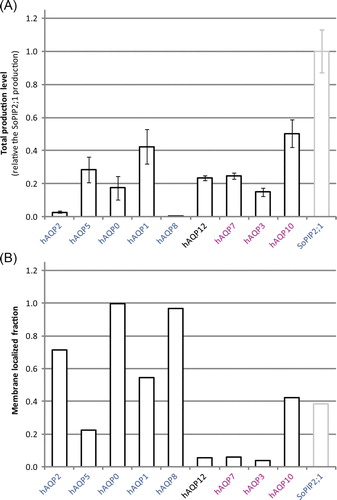
Table I. Protein production levels for all human AQPs when overproduced in Pichia pastoris. A QPs are listed based on their production level, starting with the hAQP giving the highest observed yield.
Figure 4. The nucleotide sequence following ATG affects the production of hAQPs. (A) Bar chart showing the total production level of three hAQP1 constructs being varied in the nucleotide sequence for the second codon (in paranthesis) and the C-terminal affinity tag, respectively. The first bar represents the hAQP1-Myc-His6 construct described previously Citation[23], the second and the third bar represent the hAQP1-His6 and the hAQP1GCT-Myc-His6 constructs, respectively, in this study. (B) Bar chart showing the total production level for two hAQP8 constructs being varied in the nucleotide sequence for the second codon (in paranthesis), hAQP8-His6 and hAQP8GCT-His6, respectively. The bars represent the average and standard deviation for each construct (n=3).The scale on the y-axis is the same as in A.
![Figure 4. The nucleotide sequence following ATG affects the production of hAQPs. (A) Bar chart showing the total production level of three hAQP1 constructs being varied in the nucleotide sequence for the second codon (in paranthesis) and the C-terminal affinity tag, respectively. The first bar represents the hAQP1-Myc-His6 construct described previously Citation[23], the second and the third bar represent the hAQP1-His6 and the hAQP1GCT-Myc-His6 constructs, respectively, in this study. (B) Bar chart showing the total production level for two hAQP8 constructs being varied in the nucleotide sequence for the second codon (in paranthesis), hAQP8-His6 and hAQP8GCT-His6, respectively. The bars represent the average and standard deviation for each construct (n=3).The scale on the y-axis is the same as in Figure 3A.](/cms/asset/a41bb345-eec4-4ff3-a78d-db81726e8cb8/imbc_a_386380_f0004_b.gif)
Figure 5. Overproduction of hAQP4 is affected by its folding pathway and tetramer stability. (A) Bar chart showing the total production level of the three different hAQP4 constructs analysed in this study. The production of hAQP4 was drastically increased when the amino acids close to TMD2 were mutated to mimic hAQP1 (hAQP4-M48N, L50K). An even higher significant increase was observed when an additional amino acid important for tetramer stability was mutated as well (hAQP4-M48N, L50K, N184D). The scale on the y-axis is the same as in A (B) Immunoblot showing the total protein production and membrane fraction, respectively, for hAQP4-M48N, L50K, N184D produced by fermentor growth.