Figures & data
Figure 1. Growth properties and survival of the Saccharomyces cerevisiae colony population. (A) Growth curves of colony populations measured as total biomass wet weight (right axis), total cell number and number of living cells determined either as BKP negative cells or cells able to form progeny (colony forming cells) (left axis). Number of resting cells is given in parallel (left axis). All values are calculated as the average per colony. (B) Survival of cells during long-term development of a colony shown as a percentage of BKP negative cells and colony forming cells. The total cell number at each time-point is set as 100%. The data (in A and B) give average values from four independent experiments ±SD. At each time point 2–3 giant colonies were evaluated.
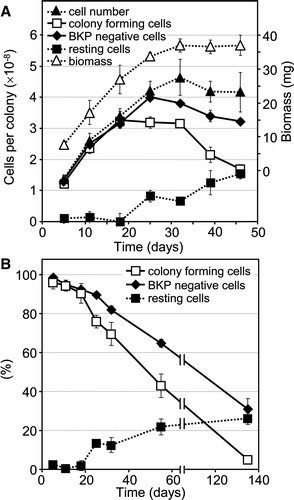
Figure 2. Changes in AvMP during development of Saccharomyces cerevisiae colonies measured by diS-C3(3) assay. The passage of colonies through individual developmental phases was monitored using the pH indicator BKP (A) as described Citation[10]. Relative AvMP was determined by position of the emission maximum at equilibrium (B) or as the initial rate of probe uptake (IRU) (C). Each point represents the average of four independent measurements from a single time-course experiment ±SD. The statistical significance of the measured oscillations is shown in Supplementary Figure S2 (online version only). The results shown are from a representative of triplicate experiments.
![Figure 2. Changes in AvMP during development of Saccharomyces cerevisiae colonies measured by diS-C3(3) assay. The passage of colonies through individual developmental phases was monitored using the pH indicator BKP (A) as described Citation[10]. Relative AvMP was determined by position of the emission maximum at equilibrium (B) or as the initial rate of probe uptake (IRU) (C). Each point represents the average of four independent measurements from a single time-course experiment ±SD. The statistical significance of the measured oscillations is shown in Supplementary Figure S2 (online version only). The results shown are from a representative of triplicate experiments.](/cms/asset/2312caf4-fc00-4e43-bc05-7975ffd73ce3/imbc_a_389485_f0002_b.jpg)
Figure 3. Short-term changes in AvMP and contribution of protons to AvMP during colony development. (A) AvMP in cells of colonies from the 1st acidic phase (7 days old – full symbols) and cells of colonies in the late 2nd alkali phase (15 days old – open symbols) measured by diS-C3(3) assay during a developmental period of 8 h. Each point represents the average of four independent measurements ±SD. (B) Measurements of (green) and
eq (red) during long-term development were performed after addition of CCCP and DM-11, respectively. The
(black) profile from B is given for comparison. The sum of the orange and yellow areas represents the contribution of protons and the blue area the contribution of other cations to the total AvMP (
). The orange area represents the membrane potential that cannot be kept when plasma membrane H+-ATPase is inhibited by DM-11. Each point is the average of four independent measurements from a single time-course experiment ±SD. The results of a representative from duplicate experiments are shown in (A) and (B).
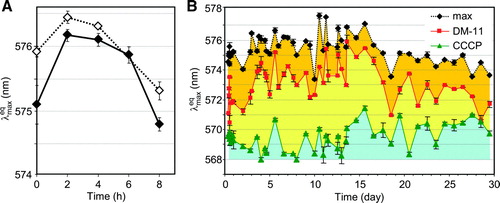
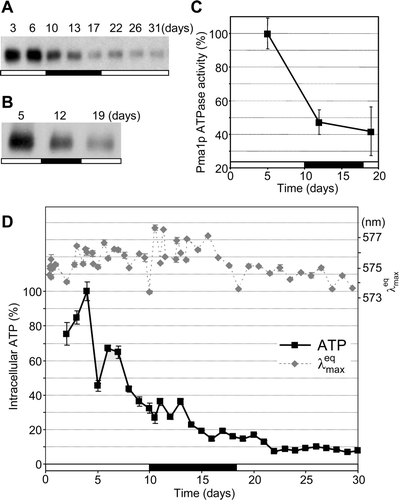
Figure 4. Changes in the amount and activity of H+-ATPase Pma1p and the intracellular ATP content during the development of Saccharomyces cerevisiae colonies. Amount of Pma1p in the whole cell lysate (A) and in the total membrane fraction (B). Pma1p H+-ATPase activity in the total membrane fraction (C); the activity measured on day 5 is set as 100% (corresponding to 271.2 nmol Pi min−1mg−1). Average values of five independent measurements ±SD are given. (D) Intracellular ATP content; the highest concentration on day 4 is set as 100% (corresponding to 1.17 µmol/g wet weight biomass). The curve of from B (right axis) is given for comparison. The average of three measurements from one representative experiment ±SD is shown. The timing of the alkali developmental phase is marked in black on the bar.