Figures & data
Table I. Peptide synthesis.
Figure 1. FTIR amide I’ band spectra. Amide I’ band of P4 peptide (panels A, D), P6 peptide (panels B, E), and P7 peptide (panels C, F) in presence of DEPE (left panels) or DPPC lipid vesicles (right panels) at the temperature indicated. Bottom spectra of each panel includes band fitting analysis with the components bands and the reconstructed spectra in dashed line, that are virtually superimposed with the original spectra. The lipid:peptide molar ratio was 10:1 (panels A, B and C) and 45:1 (panels D, E and F). The buffer spectrum was subtracted from those of the samples containing the peptides. This Figure is reproduced in colour in Molecular Membrane Biology online.
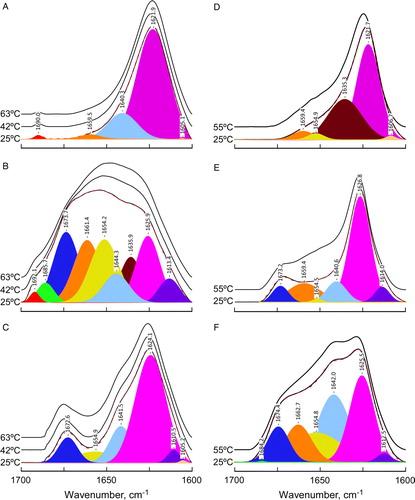
Table II. Amide I’ band components.
Figure 2. Temperature dependence of peptide conformation. (A) Absorbance ratio at 1625/1640 for P4 peptide in presence of DEPE lipid vesicles at different lipid:peptide molar ratios: 45:1 (Δ), 30:1 (▾) and 10:1 (•). (B) Left scale represents the temperature dependence of tyrosine infrared vibration for P7 peptide with DEPE lipid vesicles at lipid:peptide molar ratio 10:1. Right scale shows normalized absorbance ratio at 1624/1640 versus temperature increase in the same sample.
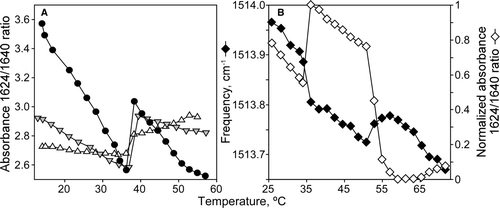
Figure 3. FTIR temperature profiles of DEPE:peptide mixtures. Temperature-dependent changes in the intensity band ratio of the carbonyl stretching modes (A, C, E) and in the frequency of the CH2 symmetric stretching (B, D, F) observed in the FTIR spectra shown by peptide-free (closed circles), and P4 (A, B), P6 (C, D), P7 (E, F) peptide-containing DEPE phospholipid bilayers at 45:1 (inverted gray triangles) and 10:1 (open triangles) lipid:peptide molar ratio.
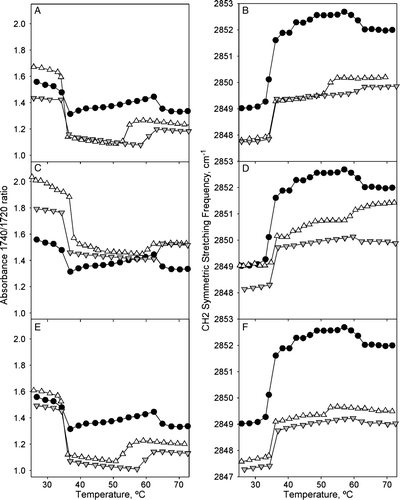
Figure 4. Tryptophan fluorescence. Stern-Volmer plots of tryptophan fluorescence quenching with acrylamide of DEPE:P4 (2.2 M−1) (--Δ--), DEPE:P6 (1.4 M−1) (––□––) and DEPE:P7 (3.2 M−1) (– –○– –) at 25°C. The excitation wavelength was at 290 nm and emission wavelength at 340 nm. Insert: Trp fluorescence emission spectra of Trp alone, lipidic pellets DEPE:P4 (----), DEPE:P6 (––––) and DEPE:P7 (– –) and the supernatants depleted of vesicles (doted line) recorded with an excitation wavelength of 280 nm. The lipid-peptide molar ratio was 20:1.
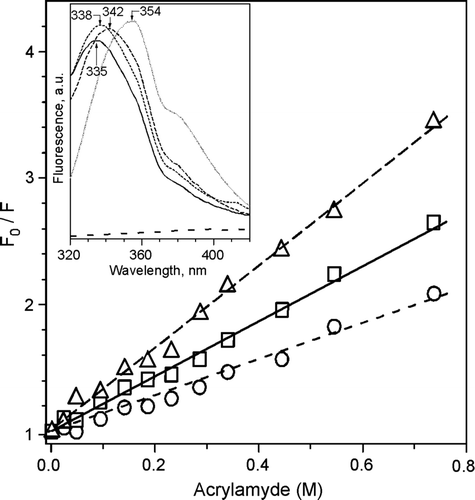
Figure 5. DSC thermograms of DEPE-peptide mixtures. (A, C) Heating and (B, D) cooling scans of DEPE alone and in presence of P4, P6 or P7 peptide at a molar ratio 10:1. DSC runs were performed at a scan rate of 1°C/min. (E, F) Effect of the peptide concentration on the calorimetric data of Lβ-to-Lα and Lα-to-HII phase transitions for DEPE:P4 (--Δ--), DEPE:P6 (––□––) and DEPE:P7 (– –○– –) mixtures.
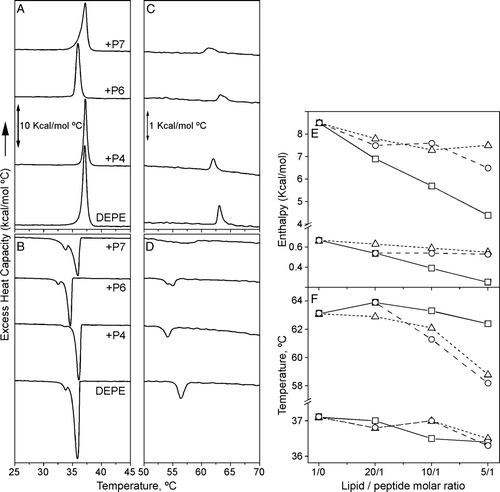
Figure 6. DSC thermograms of DPPC-peptide mixtures. DSC heating curves of DPPC alone and in presence of P4, P6 or P7 peptides at the lipid:peptide molar ratio indicated. DSC runs were performed at a scan rate of 1°C/min. The pre-transition of lipid mixtures is shown on an expanded scale.
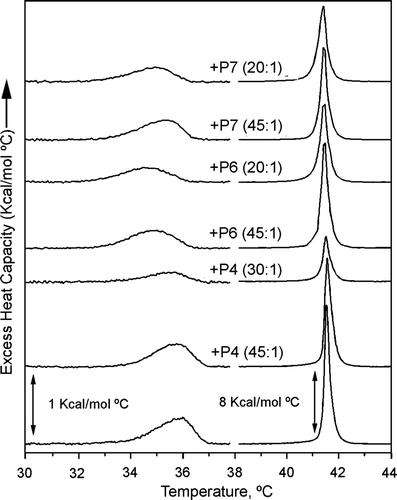
Figure 7. Linear plots of the X-ray scattering patterns of DEPE-peptide mixtures. Diffraction patterns of DEPE alone and in presence of P4, P6 or P7 at a molar ratio 20:1. The sequence of the patterns was acquired under quasi-equilibrium conditions, after equilibrating the sample during 15 min at each temperature. Successive diffraction patterns were collected during 15 s each minute. Phases identified are Lβ, Lα and HII. The Lβ-to-Lα phase transition was identified by the disappearance of the peak in the WAXS region.
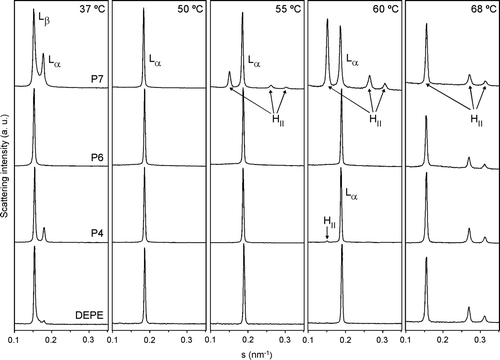
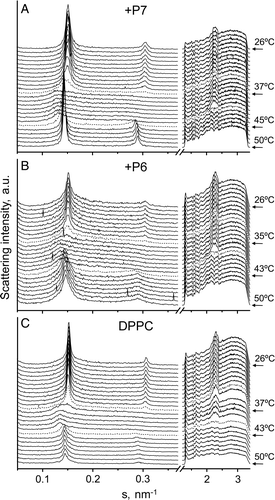
Figure 8. Sequence of X-ray scattering patterns of DPPC-peptide mixtures. Diffraction patterns of DPPC alone and in presence of P6 or P7 at a molar ratio 20:1. The sequence of the patterns was acquired under kinetic conditions with a scan rate of 1°C/min. Successive diffraction patterns were collected for 15 s each minute. Only the heating sequence from 26–50°C is shown.