566
Views
18
CrossRef citations to date
0
Altmetric
PAPERS

The M4 transmembrane segment contributes to agonist efficacy differences between α1 and α3 glycine receptors

, &
Pages 321-332 | Received 02 Apr 2009, Published online: 19 Sep 2009

Figures & data

Figure 1.  Sample current responses to glycine, β-alanine and taurine at human α1 and rat α3 GlyRs. (A) and (B) Examples of currents activated by indicated agonist concentrations (all shown in mM, glycine, top panel; β-alanine, middle panel; taurine, bottom panel) in cells expressing human α1 GlyRs (A) or rat α3 GlyRs (B). Inward currents are represented as downward deflections throughout this Figure. The response to 3 mM glycine recorded in the same cell is given next to the sample currents of β-alanine and taurine responses (far right column) for comparison. The horizontal scale of 15 s applies to all traces in this Figure and the vertical scale applies to all traces in the same row. (C) and (D) Averaged concentration-response curves of glycine (○), β-alanine (▪) and taurine (□) for the human α1 GlyRs (C) or rat α3 ?GlyRs (D). Both β-alanine and taurine response curves were generated by normalizing corresponding currents to that induced by 3 mM glycine recorded in the same cell. Mean parameters of best fit are given in .
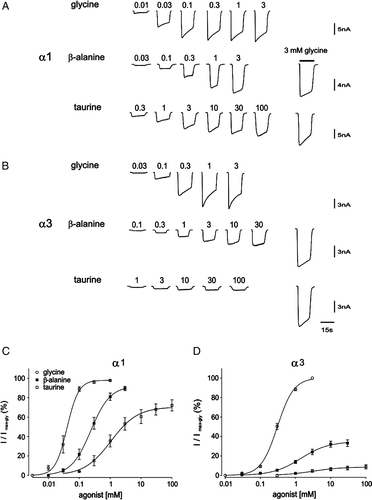
Figure 1.  Sample current responses to glycine, β-alanine and taurine at human α1 and rat α3 GlyRs. (A) and (B) Examples of currents activated by indicated agonist concentrations (all shown in mM, glycine, top panel; β-alanine, middle panel; taurine, bottom panel) in cells expressing human α1 GlyRs (A) or rat α3 GlyRs (B). Inward currents are represented as downward deflections throughout this Figure. The response to 3 mM glycine recorded in the same cell is given next to the sample currents of β-alanine and taurine responses (far right column) for comparison. The horizontal scale of 15 s applies to all traces in this Figure and the vertical scale applies to all traces in the same row. (C) and (D) Averaged concentration-response curves of glycine (○), β-alanine (▪) and taurine (□) for the human α1 GlyRs (C) or rat α3 ?GlyRs (D). Both β-alanine and taurine response curves were generated by normalizing corresponding currents to that induced by 3 mM glycine recorded in the same cell. Mean parameters of best fit are given in Table I.

Table I.  Agonist sensitivity and efficacy at wild type and chimeric GlyRs.

Figure 2.  Comparison of the maximum glycine responses and the glycine EC50 values for three wild-type subunits. (A) Individual glycine EC50 values obtained from cells expressing human α1 (unfilled triangle, n=15), human α3 (grey square, n=4) or rat α3 (black circle, n=11) GlyRs were plotted against the maximum glycine currents (Imax-gly) from the same cell. A linear regression analysis revealed no significant correlation between glycine EC50 and maximum glycine current for any of the subunits tested. (B) Comparison of maximum glycine currents for human α1, human α3 and rat α3 GlyRs. One-way ANOVA revealed no significant difference of maximum currents among the three subunits. (C) The comparison of glycine EC50 values for human α1, human α3 and rat α3 GlyRs. One-way ANOVA with post hoc Tukey's test revealed a significant difference of EC50 values between human α1 and either of the α3 subunits but not between the two α3 subunits. Bars in both B and C are shown as means±SEM. *p<0.001.
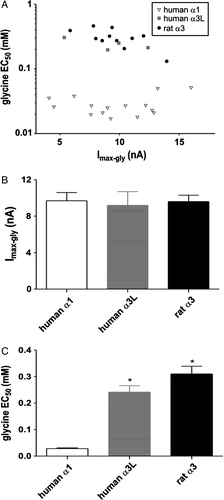
Figure 2.  Comparison of the maximum glycine responses and the glycine EC50 values for three wild-type subunits. (A) Individual glycine EC50 values obtained from cells expressing human α1 (unfilled triangle, n=15), human α3 (grey square, n=4) or rat α3 (black circle, n=11) GlyRs were plotted against the maximum glycine currents (Imax-gly) from the same cell. A linear regression analysis revealed no significant correlation between glycine EC50 and maximum glycine current for any of the subunits tested. (B) Comparison of maximum glycine currents for human α1, human α3 and rat α3 GlyRs. One-way ANOVA revealed no significant difference of maximum currents among the three subunits. (C) The comparison of glycine EC50 values for human α1, human α3 and rat α3 GlyRs. One-way ANOVA with post hoc Tukey's test revealed a significant difference of EC50 values between human α1 and either of the α3 subunits but not between the two α3 subunits. Bars in both B and C are shown as means±SEM. *p<0.001.

Figure 3.  Schematic illustration of subunit chimeras investigated in this study and amino acid sequence alignment of the M4 segment of human α1, human α3L and rat α3 subunits. (A) Symbolized illustration of the wild-type and chimeric subunits used in this study with the N-terminus at the left. The entire GlyR subunit was divided into three modules: a ligand binding domain (LBD, finishes at residue Q219 for both α1 and α3), a M1–M3 domain (including the intracellular M3–M4 loop, begins at residue M220 for both α1 and α3 and finishes at residue R392 for α1 and R400 for α3) and a M4 segment (including the C-terminal tail). Transmembrane M1–M4 helices (from left to right) are symbolized by boxes and other regions are shown as solid lines. Regions from human α1 and rat α3 are colored in grey and black, respectively. The chimera comprising the LBD from α1, the M1–M3 from α3 and the M4 from α1 is termed ‘α1/α3/α1’. All chimeras share this nomenclature. (B) Amino acid sequence alignment of the M4 segments of human α1, human α3L and rat α3 subunits (top panel) and three C-terminal tail deletion mutants (lower panel). The numbers indicate the position of the first residue in the entire subunit sequence. Non-conserved residues are shown in bold and residues mutated in this study are highlighted in grey. The last two residues of each tail deletion mutants are given as superscripts and also showed bold and italicized in the aligned amino acid sequences.
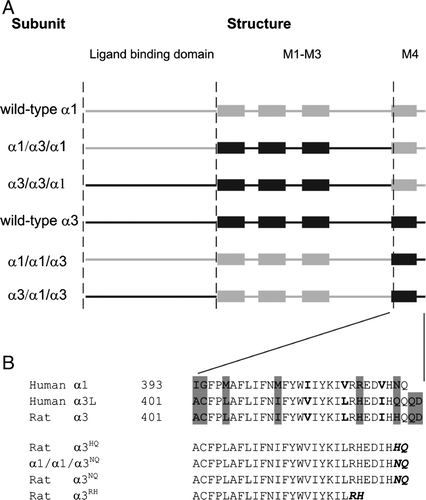
Figure 3.  Schematic illustration of subunit chimeras investigated in this study and amino acid sequence alignment of the M4 segment of human α1, human α3L and rat α3 subunits. (A) Symbolized illustration of the wild-type and chimeric subunits used in this study with the N-terminus at the left. The entire GlyR subunit was divided into three modules: a ligand binding domain (LBD, finishes at residue Q219 for both α1 and α3), a M1–M3 domain (including the intracellular M3–M4 loop, begins at residue M220 for both α1 and α3 and finishes at residue R392 for α1 and R400 for α3) and a M4 segment (including the C-terminal tail). Transmembrane M1–M4 helices (from left to right) are symbolized by boxes and other regions are shown as solid lines. Regions from human α1 and rat α3 are colored in grey and black, respectively. The chimera comprising the LBD from α1, the M1–M3 from α3 and the M4 from α1 is termed ‘α1/α3/α1’. All chimeras share this nomenclature. (B) Amino acid sequence alignment of the M4 segments of human α1, human α3L and rat α3 subunits (top panel) and three C-terminal tail deletion mutants (lower panel). The numbers indicate the position of the first residue in the entire subunit sequence. Non-conserved residues are shown in bold and residues mutated in this study are highlighted in grey. The last two residues of each tail deletion mutants are given as superscripts and also showed bold and italicized in the aligned amino acid sequences.

Figure 4.  Comparison of responses to different combinations of agonists at wild-type and chimeric subunits investigated in this study. For each cell, currents activated by 30 mM β-alanine, 30 mM taurine, 3 mM glycine plus 30 mM β-alanine and 3 mM glycine plus 30 mM taurine were recorded and normalized to that induced by 3 mM glycine in the same cell. Bars are shown as means±SEM for (A) wild-type human α1; (B) wild-type rat α3; (C) α1/α1/α3; (D) α3/α3/α1; (E) α1/α3/α1; and (F) α3/α1/α3. In this and subsequent figures, abbreviations are as follows: Gly, glycine; β-ala, β-alanine; tau, taurine. *p<0.05 indicate a statistical significance of corresponding parameters of α1/α1/α3 or α1/α3/α1 relative to α1, and α3/α3/α1 or α3/α1/α3 relative to α3 by one-way ANOVA with post hoc Tukey's test. #p<0.05 indicate a statistical significance of corresponding parameters of α3 relative to α1, α3/α3/α1 relative to α1/α1/α3, or α3/α1/α3 relative to α1/α3/α1 as determined by unpaired Student's t-test.
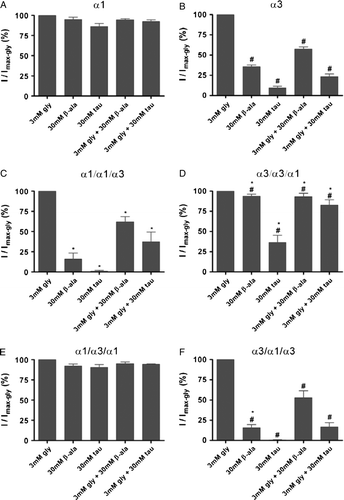
Figure 4.  Comparison of responses to different combinations of agonists at wild-type and chimeric subunits investigated in this study. For each cell, currents activated by 30 mM β-alanine, 30 mM taurine, 3 mM glycine plus 30 mM β-alanine and 3 mM glycine plus 30 mM taurine were recorded and normalized to that induced by 3 mM glycine in the same cell. Bars are shown as means±SEM for (A) wild-type human α1; (B) wild-type rat α3; (C) α1/α1/α3; (D) α3/α3/α1; (E) α1/α3/α1; and (F) α3/α1/α3. In this and subsequent figures, abbreviations are as follows: Gly, glycine; β-ala, β-alanine; tau, taurine. *p<0.05 indicate a statistical significance of corresponding parameters of α1/α1/α3 or α1/α3/α1 relative to α1, and α3/α3/α1 or α3/α1/α3 relative to α3 by one-way ANOVA with post hoc Tukey's test. #p<0.05 indicate a statistical significance of corresponding parameters of α3 relative to α1, α3/α3/α1 relative to α1/α1/α3, or α3/α1/α3 relative to α1/α3/α1 as determined by unpaired Student's t-test.

Figure 5.  Comparison of responses to different combinations of agonists at M4 segment mutants. For each cell, currents activated by 30 mM β-alanine, 30 mM taurine, 3 mM glycine plus 30 mM β-alanine and 3 mM glycine plus 30 mM taurine were recorded and normalized to that induced by 3 mM glycine in the same cell. Bars are shown as means±SEM for (A) α1I393A/G394A; (B) α1M397A; (C) α1M404A; and (D) α1N420A.
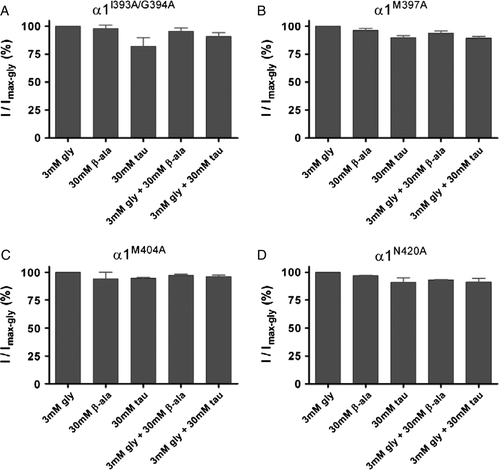
Figure 5.  Comparison of responses to different combinations of agonists at M4 segment mutants. For each cell, currents activated by 30 mM β-alanine, 30 mM taurine, 3 mM glycine plus 30 mM β-alanine and 3 mM glycine plus 30 mM taurine were recorded and normalized to that induced by 3 mM glycine in the same cell. Bars are shown as means±SEM for (A) α1I393A/G394A; (B) α1M397A; (C) α1M404A; and (D) α1N420A.

Figure 6.  Comparison of responses to β-alanine and taurine with or without glycine at wild-type and C-terminal tail deletion mutants. For each cell, currents activated by 30 mM β-alanine, 30 mM taurine, 3 mM glycine plus 30 mM β-alanine and 3 mM glycine plus 30 mM taurine were recorded and normalized to that induced by 3 mM glycine in the same cell (I/Imax-gly). (A) and (B) Comparison of α1/α1/α3 and α1/α1/α3NQ with β-alanine and β-alanine plus glycine (A), or taurine and taurine plus glycine (B). *p <0.05 with respect to α1/α1/α3 as determined by unpaired Student's t-test. (C) and (D) Comparison of α3, α3HQ and α3NQ with β-alanine and β-alanine plus glycine (C), or taurine and taurine plus glycine (D). #p<0.05 with respect to α3 as determined by one-way ANOVA with post hoc Tukey's test.
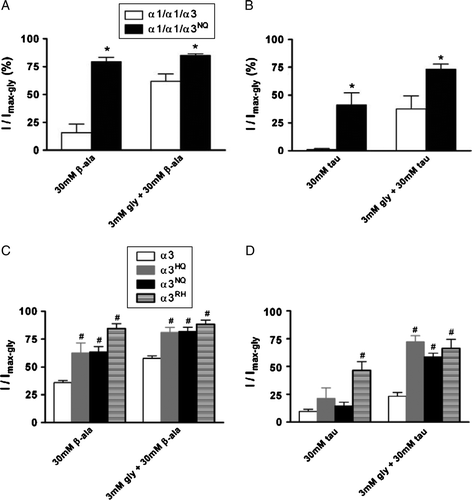
Figure 6.  Comparison of responses to β-alanine and taurine with or without glycine at wild-type and C-terminal tail deletion mutants. For each cell, currents activated by 30 mM β-alanine, 30 mM taurine, 3 mM glycine plus 30 mM β-alanine and 3 mM glycine plus 30 mM taurine were recorded and normalized to that induced by 3 mM glycine in the same cell (I/Imax-gly). (A) and (B) Comparison of α1/α1/α3 and α1/α1/α3NQ with β-alanine and β-alanine plus glycine (A), or taurine and taurine plus glycine (B). *p <0.05 with respect to α1/α1/α3 as determined by unpaired Student's t-test. (C) and (D) Comparison of α3, α3HQ and α3NQ with β-alanine and β-alanine plus glycine (C), or taurine and taurine plus glycine (D). #p<0.05 with respect to α3 as determined by one-way ANOVA with post hoc Tukey's test.

Table II.  The agonist sensitivity and efficacy at C-terminal tail deletion mutants investigated in this study.

Reprints and Corporate Permissions

Please note: Selecting permissions does not provide access to the full text of the article, please see our help page How do I view content?

To request a reprint or corporate permissions for this article, please click on the relevant link below:

Academic Permissions

Please note: Selecting permissions does not provide access to the full text of the article, please see our help page How do I view content?

Obtain permissions instantly via Rightslink by clicking on the button below:

If you are unable to obtain permissions via Rightslink, please complete and submit this Permissions form. For more information, please visit our Permissions help page.