Figures & data
Figure 1. Analysis of 22 highly conserved positions in the pore of Kat1. (A) Two subunits of the KcsA channel (Protein Data Bank structure 1bl8 ‘Potassium channel (KCSA) from Streptomyces lividans’ Citation[1], Citation[38]) are shown in which the analogous positions to the 22 amino acids that were mutated in Kat1 are highlighted (PyMOL software) Citation[39]. Shown in green are the five amino acids of the selectivity filter; in blue, the 11 amino acids upstream of the selectivity filter; and in red, the six amino acids downstream of the selectivity filter. (B) The amino acids from the pore region of Kat1 were aligned to the following K+ channels: KcsA Citation[40] from S. lividans Shaker Citation[41] from D. melanogaster, MthK Citation[42] from M. thermoautotrophicum, KirBac Citation[5] from B. pseudomallei, KvAP Citation[43] from A. pernix, and Kv1.2 Citation[44] from R. norvegicus. This Figure is reproduced in colour in Molecular Membrane Biology online.
![Figure 1. Analysis of 22 highly conserved positions in the pore of Kat1. (A) Two subunits of the KcsA channel (Protein Data Bank structure 1bl8 ‘Potassium channel (KCSA) from Streptomyces lividans’ Citation[1], Citation[38]) are shown in which the analogous positions to the 22 amino acids that were mutated in Kat1 are highlighted (PyMOL software) Citation[39]. Shown in green are the five amino acids of the selectivity filter; in blue, the 11 amino acids upstream of the selectivity filter; and in red, the six amino acids downstream of the selectivity filter. (B) The amino acids from the pore region of Kat1 were aligned to the following K+ channels: KcsA Citation[40] from S. lividans Shaker Citation[41] from D. melanogaster, MthK Citation[42] from M. thermoautotrophicum, KirBac Citation[5] from B. pseudomallei, KvAP Citation[43] from A. pernix, and Kv1.2 Citation[44] from R. norvegicus. This Figure is reproduced in colour in Molecular Membrane Biology online.](/cms/asset/139626f3-2f8c-46de-a78a-b7e8f8212e44/imbc_a_419006_f0001_b.jpg)
Figure 2. Activity and specificity of mutant Kat1 channels expressed in trk1Δ trk2Δ and TRK1 TRK2 cells. (A) Point mutations were introduced into residues of the highly conserved pore region of Kat1 from position 249–270. Mutant channels were expressed in trk1Δ trk2Δ and growth was assessed on permissive medium (100 mM KCl), low K+ media (2 or 0.1 mM KCl), and 2 mM KCl media supplemented with Na+ (150 and 500 mM NaCl). (B) To test for increased Na+ permeation, mutant channels were expressed in TRK1 TRK2 cells and growth was assessed on permissive medium (100 mM KCl) and media supplemented with Na+ (1.5 mM KCl/700 mM NaCl).
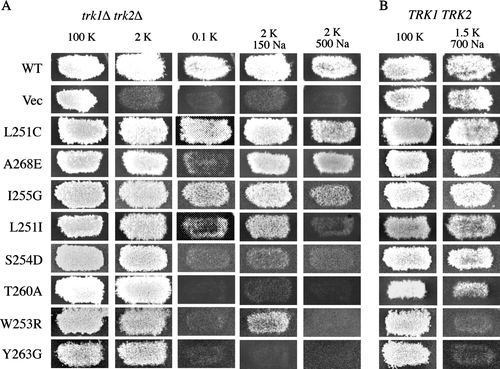
Table I. Positions of amino acid substitutions in Kat1 used in this study and phenotypes of mutant channels determined in Saccharomyces cerevisiae.
Figure 3. Two-electrode voltage clamp analysis of a sodium permeable Kat1 channel. Currents elicited from wild-type Kat1 and W253R in bath solutions containing 100 mM K+ and 100 mM Na+. Cells were held at −40 mV and hyperpolarized to −150 mV in 10 mV steps. Leak currents were subtracted using a P/6 method.
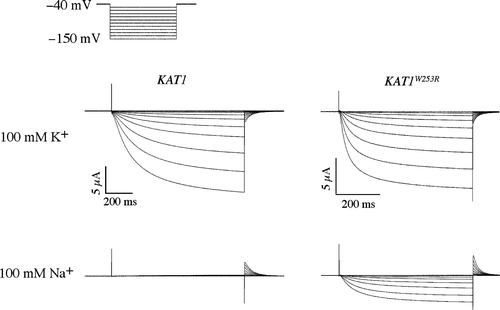
Figure 4. Two-electrode voltage clamp analysis of a sodium blocked Kat1 channel. Currents elicited from wild-type Kat1 and T260A in bath solutions containing 100 mM K+, 50 mM K+/50 mM Na+, 10 mM K+/90 mM Na+, and 100 mM Na+. Oocytes were held at −40 mV and hyperpolarized to −150 mV in 10 mV steps. Leak currents were subtracted using a P/6 method Citation[25].
![Figure 4. Two-electrode voltage clamp analysis of a sodium blocked Kat1 channel. Currents elicited from wild-type Kat1 and T260A in bath solutions containing 100 mM K+, 50 mM K+/50 mM Na+, 10 mM K+/90 mM Na+, and 100 mM Na+. Oocytes were held at −40 mV and hyperpolarized to −150 mV in 10 mV steps. Leak currents were subtracted using a P/6 method Citation[25].](/cms/asset/c5bb96d6-7e8d-4a7a-b6e7-208d23bcf47b/imbc_a_419006_f0004_b.gif)
Figure 5. Testing mutant Kat1 channels for Na+ resistance. (A) To assess channel function and confirm that channels were not sensitive to Na+, the mutant Kat1 channels were expressed in trk1Δ trk2Δ growth was assessed on permissive medium (100 mM KCl) and 2 mM KCl media supplemented with Na+ (150 and 500 mM NaCl). Na+ resistance was shown by observing enhanced growth of (A) trk1Δ trk2Δ and (B) TRK1 TRK2 cells expressing mutant Kat1 channels on medium supplemented with 0.1 mM KCl/600 mM NaCl.
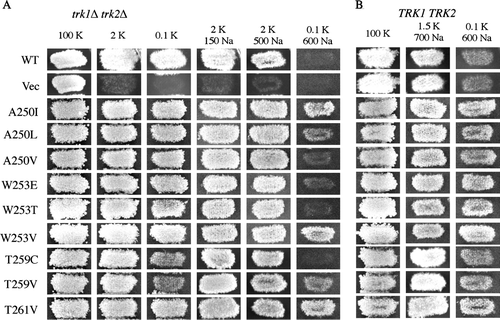
Figure 6. Two-electrode voltage clamp analysis of a sodium resistant Kat1 channel. Currents elicited from wild-type Kat1 and W253V in bath solutions containing 100 mM K+, 10 mM K+/90 mM Na+, 1 mM K+/99 mM Na+, and 100 mM Na+. Cells were held at −40 mV and hyperpolarized to −150 mV in 10 mV steps. Leak currents were subtracted using a P/6 method.
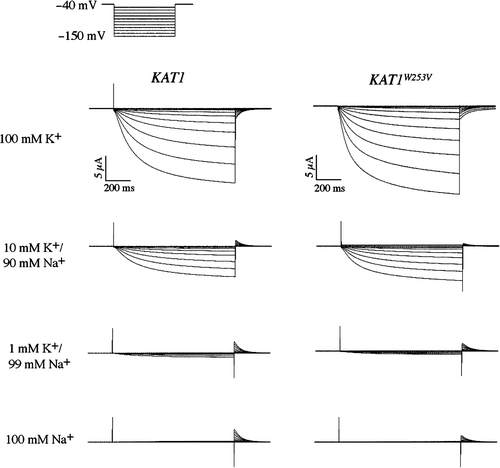
Figure 7. Cesium and TEA-associated growth phenotypes conferred by mutant Kat1 channels. (A) trk1Δ trk2Δ cells expressing Kat1 channels were grown on permissive medium (100 mM KCl), low K+ media (2 or 0.1 mM KCl), and 2 mM KCl media supplemented with Cs+ (5 and 15 mM CsCl) or TEA+ (75 and 150 mM TEA+). (B) In wild-type cells, growth was assessed on permissive medium (100 mM KCl) and media supplemented with Na+ (1.5 mM KCl/700 mM NaCl or 0.1 mM KCl/600 mM NaCl).
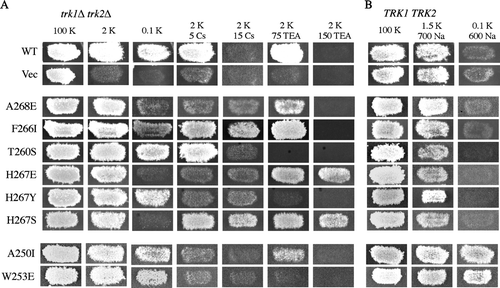
Figure 8. Two-electrode voltage clamp analysis of a cesium resistant Kat1 channel. Currents elicited from wild-type Kat1 and F266I in bath solutions containing 90 mM K+ and 90 mM K+/10 mM Cs+. Cells were held at −40 mV and hyperpolarized to −150 mV in 10 mV steps. Leak currents were subtracted using a P/6 method.
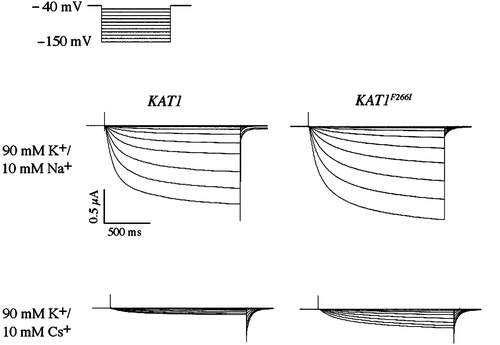
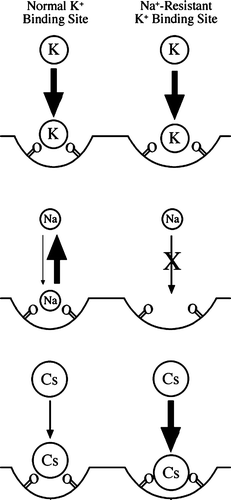
Figure 9. Model of a K+ selective binding site on the surface of the channel. Two binding sites are modeled, one for normal K+-binding (left) and Na+-resistant K+ binding (right). The possible interactions between these sites and K+, Na+, and Cs+ ions are shown. The arrows represent tight binding (large arrow), weak binding (small arrow), reversible binding (two arrows), and no binding (X-out arrow).
