Figures & data
Table I. Oligonucleotide primer sequences used for RT-PCR.
Figure 1. Expression of PLD isoforms and formyl peptide receptors in human colonic cell line HT29. (A) RT-PCR products were visualized with agarose gel electrophoresis in the presence of ethidiumbromide. β-actin (housekeeping gene) was used as an internal control. The results are representative assays from three separate experiments with similar results. See for additional information. (B) Cells were fixed and labelled with anti-PLD1 or PLD2 antibodies. Nuclear counterstaining (blue) was additionally used. The figures show representative results from one of three independent experiments performed in duplicate. Scale bar: 20 µm. Published in colour in the online version.
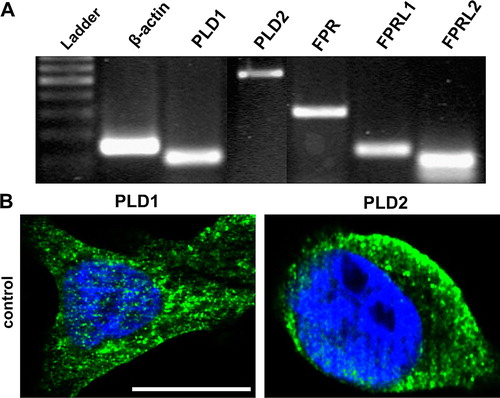
Figure 2. Inhibition of PLD1 and 2 expressions in HT29 cells by siRNA. SiRNA for PLD1 and 2 as well as control siRNA was transfected in HT29 cells. 96 h later the down-regulation of PLD1 (A) and PLD2 (B) mRNA expression was analyzed using TaqMan real time RT-PCR compared to the untreated sample. 18 s (housekeeping gene) was used as an internal control. The data were assessed from three independent experiments performed in triplicate. (C) PLD1 and 2 protein expression was evaluated with immunblotting. Two additional experiments produced similar results. The mean±SD of the three independent experiments was evaluated by densitometric quantification, (D) PLD1 and (E) PLD2. An asterisks indicates a significant difference (*, p<0.05; **, p<0.001) compared to a control siRNA using ANOVA followed by the Bonferroni test.
Figure 3. Decreased PLD activity in HT29 cells after siRNA transfection. After 96 h of post-transfection, HT29 cells were incubated in a serum-free medium containing 2% ethanol and exposed to either 1 µM PMA or fMLF for 30 min at 37°C. PLD activity was determined as described in Material and methods. Note that PMA and fMLF increased PLD activity. The PMA- and fMLF mediated stimulation of PLD activity was blocked by PLD1 and 2 siRNA. Values represent mean±SD from four independent experiments. An asterisk indicates a significant difference (*, p<0.05) compared to a control using ANOVA followed by the Bonferroni test.
Figure 4. Inhibition of formyl peptide receptor activity by PLD1 or PLD2 siRNA transfection in HT29 cells. For analysis of inhibition of forskolin-stimulated adenylate cyclase activity, after 96 h of post-transfection (A), HT29 cells were subjected to 10 µM forskolin and 1 µM fMLF, NECA and PMA or NECA and PMA without forskolin stimulation (B) for 15 min at 37°C. cAMP levels were determined as described above (see Material and methods). Values represent mean±SD from four independent experiments. An asterisks indicates a significant difference (*, p<0.05; **, p<0.001) between forskolin and forskolin with agonists or control and agonists (B) as determined using ANOVA followed by the Bonferroni test. For analysis of ERK1/2 phosphorylation, HT29 cells were transfected with siRNA for PLD1, 2 or control siRNA or untransfected (C). Each was treated with 1 µM fMLF, NECA or PMA or alone for 5 min at 37°C. The cells were lysed, equal amounts of protein (5 µg) were resolved by the SDS sample buffer, and the levels of total ERK2 and phosphorylated ERK1/2 were determined using immunoblotting. The positions of phospho-ERK1/2 (pERK1/2) and total ERK2 (ERK2) are indicated on the right. The positions of molecular mass markers are indicated on the left (in kDa). The mean±SD of the three independent experiments from (B) was evaluated using densitometric quantification (D). An asterisk indicates a significant difference (*, p<0.05) compared to controls using ANOVA followed by the Bonferroni test.
Figure 5. Inhibition of formyl peptide receptor activity by 2,3-DPG in HT29 cells. For analysis of inhibition of forskolin-stimulated adenylate cyclase activity (A), HT29 cells were subjected to 10 µM forskolin and 1 µM fMLF or NECA with or without 5 mM 2,3-DPG or alone for 15 min at 37°C. cAMP levels were determined as described above (see Materials and methods). Values represent mean±SD from four independent experiments. An asterisks indicates a significant difference (*, p<0.05) between forskolin or forskolin with plus 2,3-agonists as determined using ANOVA followed by the Bonferroni test. For analysis of ERK1/2 phosphorylation (B), HT29 cells were treated with 1 µM fMLF or NECA with or without 5 mM 2,3-DPG or alone for 5 min at 37°C. The cells were lysed, equal amounts of protein (5 µg) were resolved by the SDS sample buffer, and the levels of total ERK2 and phosphorylated ERK1/2 were determined using immunoblotting. The positions of phospho-ERK1/2 (pERK1/2) and total ERK2 (ERK2) are indicated on the middle. The positions of molecular mass markers are indicated on the left and right (in kDa). The mean±SD of the three independent experiments from (B) was evaluated using densitometric quantification (C). An asterisk indicates a significant difference (*, p<0.05) compared to controls using ANOVA followed by the Bonferroni test.
Figure 6. No change of receptor expression level after siRNA transfection in HT29 cells. After 96 h of post-transfection, RT-PCR products for formyl peptide receptors were visualized with agarose gel electrophoresis in the presence of ethidiumbromide. β-actin (housekeeping gene) was used as an internal control. The results are representative assays from three separate experiments with similar results. See for additional information.
Figure 7. Altered distribution of formyl peptide receptors after PLD1 and 2 siRNA transfection. After 96 h of post-transfection, HT29 cells were fixed and labelled with anti-FPR, FPRL1 and FPRL2 antibodies. Internalization of formyl peptide receptors was examined by fluorescence microscopy. Nuclear counterstaining (blue) was additionally used. The Figures show representative results from one of three independent experiments performed in duplicate. Scale bar: 20 µm. Published in colour in the online version.
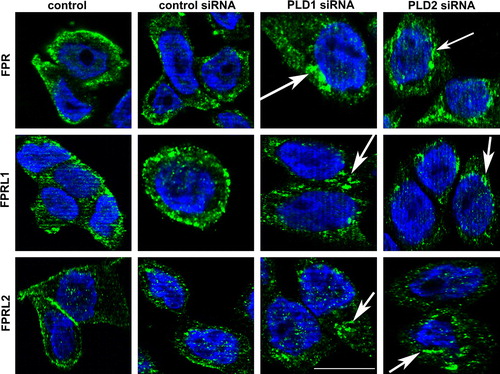
Figure 8. Inhibition of PLD1 and 2 by siRNA transfection induced increased internal locations of formyl-peptide-receptors. After 96 h of post-transfection, HT29 cells were each subjected to 1 µM fMLF for 60 min at 37°C as indicated. Cells were fixed using Zamboni and the surface receptors were labeled with rabbit anti-FPR, FPRL1 and FPRL2 antibodies followed by peroxidase-conjugated antibodies (without methanol permeabilization). Formyl peptide receptor endocytosis, quantified as the percentage loss of labelling surface receptors in relation to the optical density (OD) of the control (defined as 100%), was measured using ELISA as described in Material and methods. Values represent mean±SD from four independent experiments. An asterisks indicates a significant difference (*, p<0.05; **, p<0.001) compared to control siRNA without fMLF using ANOVA followed by the Bonferroni test. Published in colour in the online version.