
Figures & data
Figure 1. Structure of fluorescent probe (A) NBD-DOPE; (B) C6-NBD-PC.
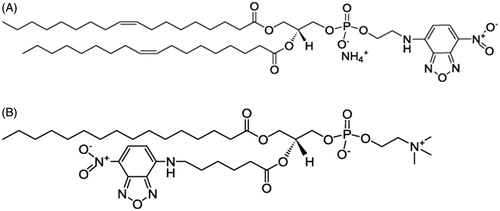
Figure 2. Fluorescence images as a function of temperature for GUVs of (A) 30:70 POPC/DPPC; (B) 50:50 POPC/DPPC; (C) 70:30 POPC/DPPC. Each sample contains 1 mol% NBD-DOPE.
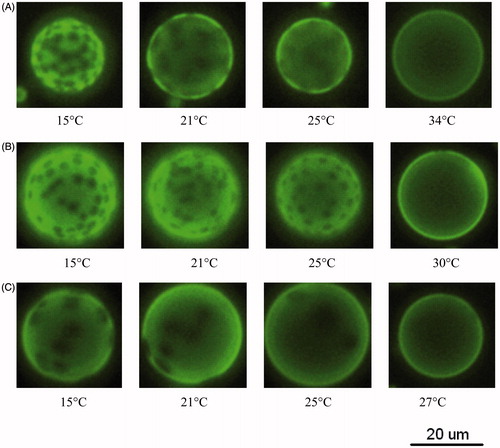
Figure 3. 2H NMR spectra of 50:50 POPC/DPPC-d31 and 50:50 POPC-d31/DPPC at (A) 17 °C; (B) 33 °C.
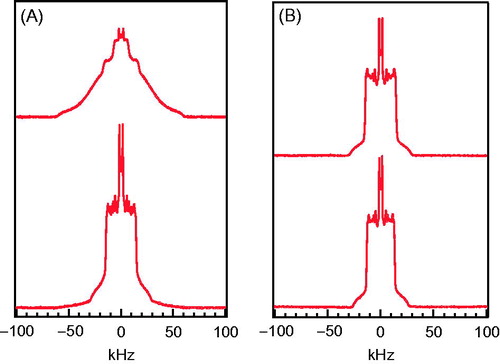
Figure 4. Fluorescence image as a function of temperature for GUVs of (A) 30:70 POPC/DPPC; (B) 50:50 POPC/DPPC; (C) 70:30 POPC/DPPC. Each sample contains 1 mol% C6-NBD-PC.
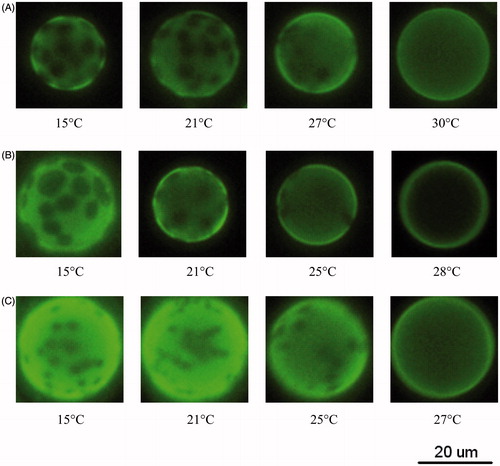
Table 1. A comparison for Tmis,1 of NBD-DOPE-containing GUVs, Tmis,2 of NBD-DOPE-containing GUVs, and Tend measured without the fluorescent probe. Considering that the transition temperature was reduced by 2 °C due to the lipid chain deuteration, the transition temperature for non-deuteraturated lipid bilayers should be shifted by +2 °C.