Figures & data
Figure 1. Examples of sub nm membrane protein structures determined by cryo-EM. Examples showing EM reconstructions of RyR1 (EMDB-2807), Piezo1 (EMDB-6343), γ-secretase (EMDB-3061) and Cav1.1 (EMDB-6475) (grey density) with fitted atomic models. This Figure is reproduced in colour in Molecular Membrane Biology online.
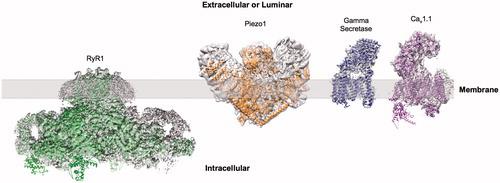
Figure 2. Mean resolution vs year of deposition within the EMDB. Analysis of the average resolution of deposited membrane protein structures within the EMDB in each year is shown in black. Highest resolution reconstruction deposited each year is show in grey. The general trend shows the resolution steadily increasing over time.
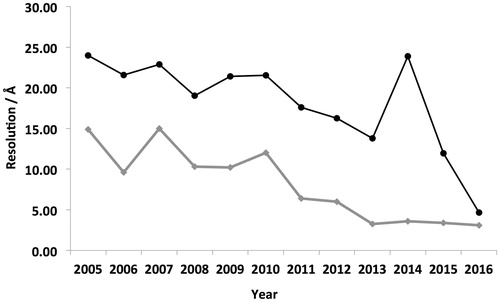
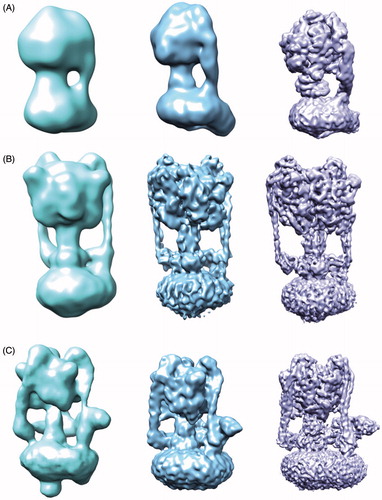
Figure 3. Increasing resolution of the ATPase family structures from EM. (A) F-ATPase structures determined by EM from ∼32 Å to 6.4 Å (EMDB accession codes: 1357,2091,3169). (B) A-ATPase structures determined by EM from ∼16–6.4 Å (EMDB accession codes: 1888,5335,8016). (C) V-ATPase structures determined by EM from ∼17–6.9 Å (EMDB accession codes: 1590,5476,6284). This Figure is reproduced in colour in Molecular Membrane Biology online.