Figures & data
Figure 1. Cryogenic TEM image of the (a) DSPE-pHLIP (5 mol%) , (b) Pyr-pHLIP (5 mol%) coated Span20 (45 mol%) and cholesterol (50 mol%) niosomes. The images are obtained at 25,000× magnification and (c) The fluorescence spectra of Pyr-pHLIP measured in methanol and Pyr-pHLIP incorporated in niosomes.
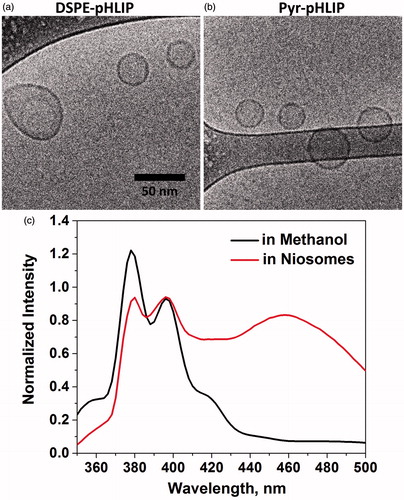
Table 1. The center of Gauss distribution (DTEM) and the standard deviation obtained after fitting of histograms of niosome’s diameter distributions (shown on Figure S2) calculated by analyzing cryo-TEM images. The mean hydrodynamic diameter (Dh), the zeta potential (ξ) and the polydispersity index (PDI) were obtained from the dynamic light scattering measurements performed on niosomes in HEPES buffer at pH 7.4. DSPE-pHLIP and Pyr-pHLIP (5 mol%) coated Span20 (45 mol%) and cholesterol (50 mol%) niosomes were used.
Figure 2. Normalized uptake of DSPE-pHLIP (5 mol%) and Pyr-pHLIP (5 mol%) coated Span20 (43 mol%) and cholesterol (50 mol%) niosomes containing 2 mol% of fluorescent R18 by 4T1 mammary (a) and A549 lung (b) cancer cells at pH 7.8 and pH 5.5 before (magenta columns) and after (gray columns) treatment with Trypan blue. The fluorescent signals were normalized by the rhodamine fluorescence intensity of 4T1 cells at pH 7.8 treated with DSPE-pHLIP before addition of Trypan blue. Statistically significant differences were determined by two-tailed unpaired Student’s t-test, only statistically non-significant differences are indicated (ns means p level >0.05), all other differences in cellular uptake calculated at different pH’s, as well as before and after Trypan Blue addition are statistically significant (plevel is less than 0.0001 in each case). The distribution of fluorescent signal in cells is presented in Figure S4.
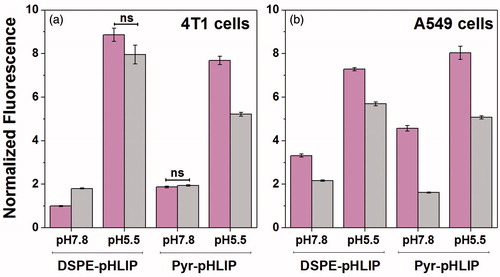
Figure 3. Uptake and cellular distribution of (a–d) DSPE-pHLIP (5 mol%) and (e–h) Pyr-pHLIP (5 mol%) coated Span20 (43 mol%) and cholesterol (50 mol%) niosomes containing 2 mol% of fluorescent R18 by A549 lung cancer cells. Cells were treated with fluorescence niosomes at pH 6.4 for 1 hour, followed by washing, seeding cells in glass bottom collagen coated cell dishes and imaging at next day. Fluorescence (a, b, e, f) and phase contrast (c, d, g, h) images were obtained using 20× (a, c, e, g) and 40× (b, d, f, h) magnification objective lenses.
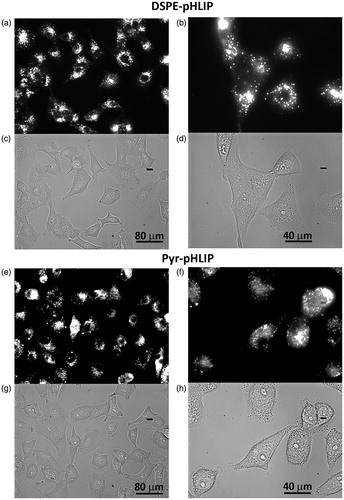
Figure 4. Time-dependent distribution of DSPE-pHLIP and Pyr-pHLIP (5 mol%), Span20 (43 mol%), cholesterol (50 mol%) and R18 (2 mol%) niosomes in a) tumor, b) muscle, c) kidney and d) liver at 4, 24 and 48 hours after single I.V. administration of the constructs. Tumor/Muscle (T/M), Tumor/Kidney (T/K) and Tumor/Liver (T/L) ratio calculated for DSPE-pHLIP (e) and Pyr-pHLIP (f) niasomes are shown. The values of mean surface fluorescence intensity of R18 in tissue and organs are presented in Table S1.
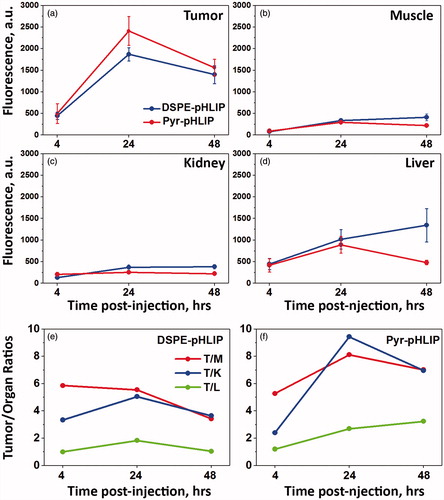
Figure 5. (a) The representative rhodamine fluorescence images and (b) mean surface fluorescence of tumor (cut in half ), muscle, kidney (cut in half) and liver obtained by ex vivo imaging after collection of organs and tissues 24 hours after I.V. administration of pHLIP and PEG coated niosomes are shown (the autofluorescence signal is subtracted). The color coded fluorescent images shown on panel (a) are obtained at the same settings of the imaging instrument, the same exposure time (15 sec) and all of them were processed exactly the same way. Control is the organs collected from the mouse with no injection of fluorescent niosomes and it represents level of auto fluorescence signals in tissue. The values of mean surface fluorescence intensity of R18 in tissue and organs are presented in Table S2.
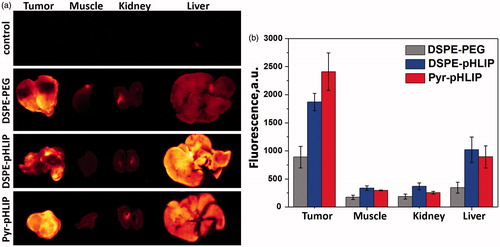
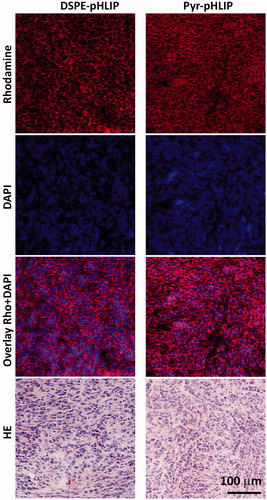
Figure 6. Distribution of R18 fluorescent signal in tumor sections obtained at 24 hours after I.V. injection of (a–d) DSPE-pHLIP (5 mol%) and e–h) Pyr-pHLIP (5 mol%) coated Span20 (43 mol%), cholesterol (50 mol%) and R18 (2 mol%) niosomes. The rhodamine fluorescence (a, e), cell nucleus stained with DAPI (b, f), the overlay of rhodamine and DAPI fluorescence (c, g), and adjacent HE stained sections from the same tumor (d, h) are shown.