Figures & data
Table 1. Primers used in this study.
Figure 1. The membrane topology of CmPP predicted by the online program MEMSAT3 (A), and the feature residue determination for K+-dependence of CmPP by sequence alignment (B). CmPP contains 16 transmembrane helix segments (S1–S16) with distinct numberings. The feature residue Ala (A) for membrane PPase K+-dependence is boxed.
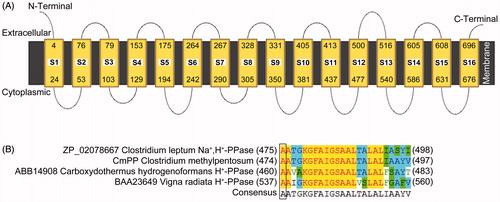
Figure 2. Salt tolerance of E. coli could be improved by heterologous expression of CmPP, as judged by comparing the growth of E. coli strain BL21(DE3) harboring the recombinant vector pET(CmPP) or the empty vector pET32a(+) under salt stresses of different NaCl concentrations. (A) Dot-plating test with serial dilutions (1-, 5-, 10-, 20-, 40-fold) for the colony growth of E. coli; (B) Spectrometric analysis for the dynamic growth curve of E. coli. The control (CK) means the intrinsic NaCl concentration (0.17 M) in LB medium. Error bars represent the SD of three separate trials with different clones of each E. coli.
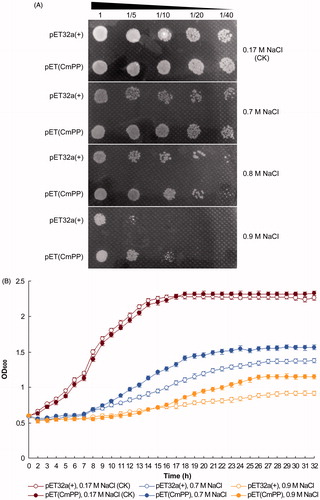
Figure 3. Salt tolerance of S. cerevisiae could be enhanced by heterologous expression of CmPP, as assessed by comparing the growth of salt-sensitive yeast strain ena1- carrying the recombinant vector pYES2(CmPP) or the empty vector pYES2 under salt stresses of different NaCl concentration. (A) Dot-plating test with serial dilutions (1-, 5-, 10-, 20-, 40-fold) for the colony growth of S. cerevisiae; (B) Spectrometric analysis for the dynamic growth curve of S. cerevisiae. The control (CK) means the intrinsic NaCl concentration (0 M) in YPG medium. Error bars represent the SD of three separate trials with different clones of each yeast strain.
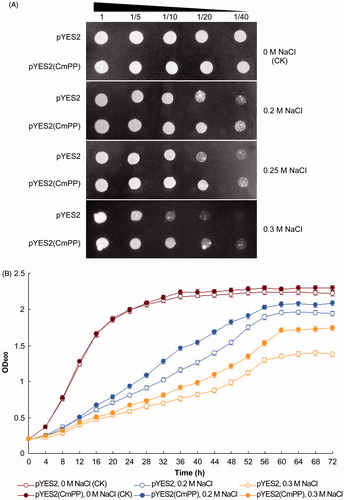
Figure 4. Fortification of CmPP-mediated salt tolerance in S. cerevisiae by N-terminal addition with a vacuole-targeting signal peptide. (A) The diagram of chimaeric CmPP with the signal peptide (SPtc) of T. cruzi H+-PPase, arrowhead indicates the putative cleavage site of SPtc; (B) Dot-plating test with serial dilutions (1-, 5-, 10-, 20-, 40-fold) to compare the colony growth of salt-sensitive S. cerevisiae strain ena1- harboring the chimaeric vector pYES2(SPtc-CmPP), the expression vector pYES2(CmPP), or the empty vector pYES2 under high salt stresses of different NaCl concentrations.
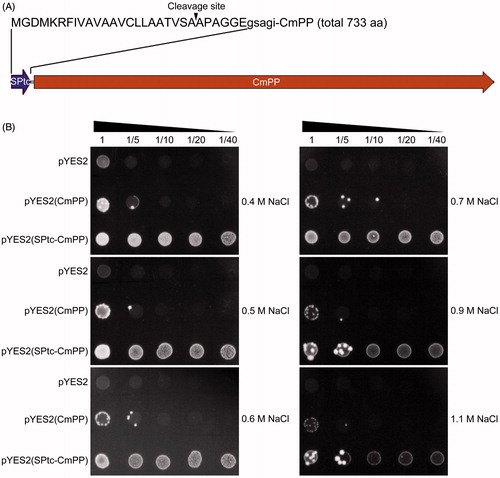
Figure 5. Leaf chlorosis comparison of three CmPP transgenic lines (CmPP-9, CmPP-11, CmPP-12) vs. WT tobacco, by submerging their leaf discs into salt solutions (0 mM (CK), 500 mM, 1000 mM NaCl) for 5 d.
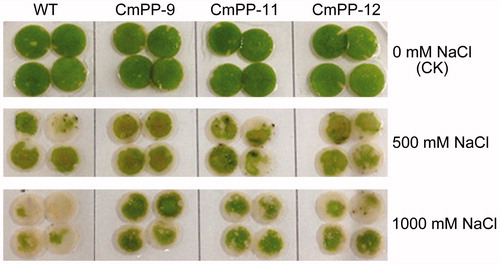
Figure 6. Physiological comparison of three CmPP transgenic lines (CmPP-9, CmPP-11, CmPP-12) vs. WT tobacco under salt treatments (0 mM (CK), 300 mM, 500 mM NaCl), in respect of the total chlorophyll content (A), root activity (B), leaf MDA content (C), and leaf electrolyte leakage (D). Error bars represent the SD of three separate trials with different plants of each transgenic line or WT tobacco.
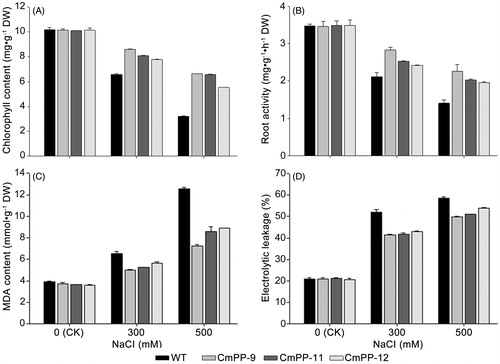
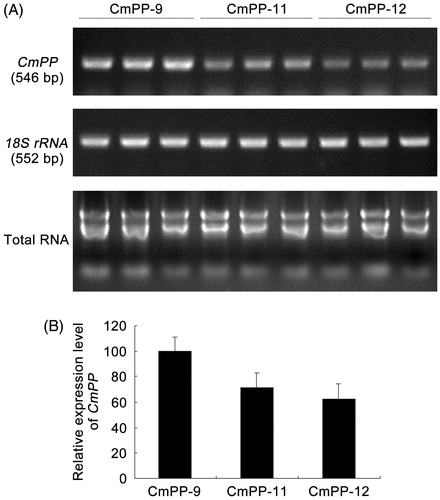
Figure 7. CmPP expression in transgenic tobacco lines (CmPP-9, CmPP-11, CmPP-12) analyzed by semi-quantitative RT-PCR (A) and subsequent gel-band gray densitometric estimation (B). Error bars represent the SD of three separate trials with different plants of each transgenic line.