Figures & data
Figure 1. Molecular structures of Choline (a), BEH (b), DEP (c) and TMP (d) with partial atom charges along with the structure of DPPC lipid (e).
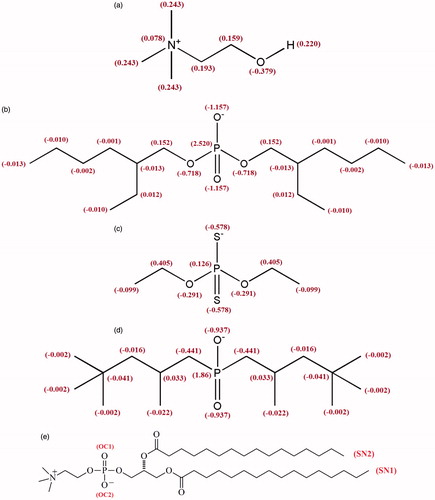
Figure 2. Mass density of different components for DPPC lipid bilayer system (a), different anionic species of ILs (b), and water (c).
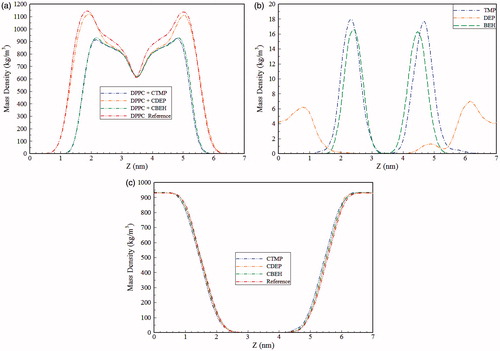
Table 1. Coordination numbers of water to DPPC atoms in the simulated systems.
Figure 3. Free energy profiles for anionic species of ILs along the bilayer z-axis.
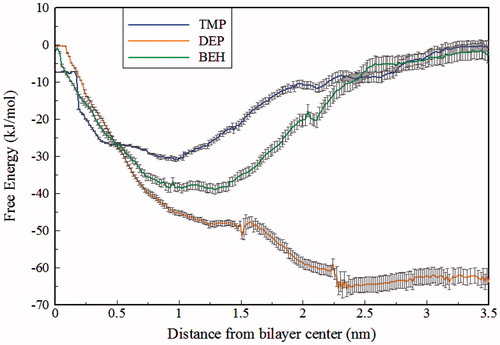
Figure 4. Snapshots of the final configuration of the DPPC lipids and water molecules and ILs, BEH (Green) (a), DEP (Orange) (b), TPM (Blue) (c). In all systems choline is as yellow.
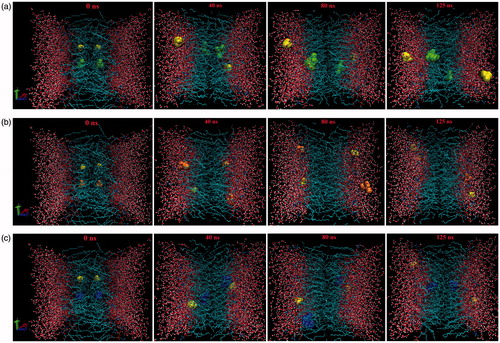
Figure 5. Electrostatic potential of the simulated systems.
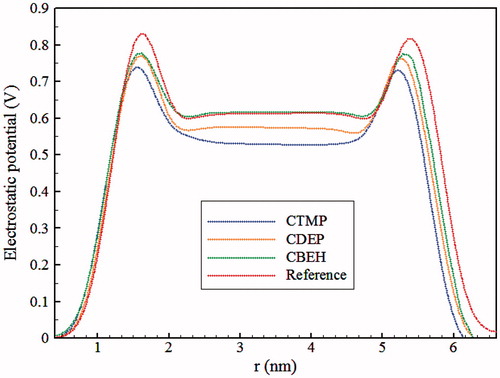
Table 2. The values of area per lipid (APL), thickness of bilayer (DB), lipid lateral diffusion coefficient (DL), anion species lateral diffusion coefficient (DA), electrostatic potential in the middle of membrane (ωMid), maximum electrostatic potential (ωMax) and DPPC head group P–N tilt angle (αP–N) of the simulated bilayer systems.
Figure 6. The deuterium order parameters for different carbon atoms in the SN-1 and SN-2 chains in presence three kinds of ILs.
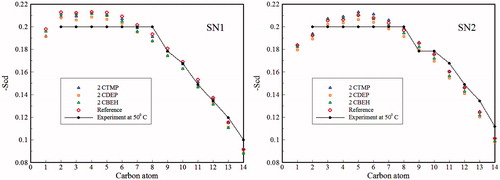
Table 3. Average number of different hydrogen bonds in the simulated systems.
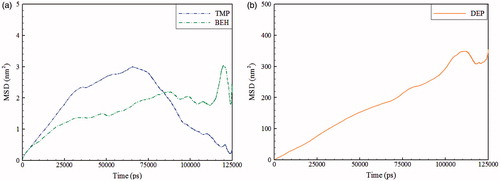
Figure 7. The mean square displacement of the anion species of ILs in the simulated systems, BEH and TMP (a), and DEP (b).