15,901
Views
3
CrossRef citations to date
0
Altmetric
Review Article

Structural biology of solute carrier (SLC) membrane transport proteins

, &
Pages 1-32 | Received 03 Dec 2017, Accepted 27 Feb 2018, Published online: 13 Apr 2018

Figures & data

Figure 1. Representative available structures from different SLC families. Structures are downloaded from PDB (www.pdb.org) and presented using PyMOL (www.pymol.org). The helices were colored using rainbow from N to C terminal, with hues from blue through cyan closer to N terminal, while red through yellow closer to C terminal. Therefore, The TM regions are traceable in each structure by following the colors. Specifically, in MFS fold family members (e.g. LacY, GlpT, XylE, PepTso and EmrD), cool colors and warm colors are falls into two bundles, meaning that N and C terminal are separated into two bundles. This Figure is reproduced in color in Molecular Membrane Biology online.

Figure 1. Representative available structures from different SLC families. Structures are downloaded from PDB (www.pdb.org) and presented using PyMOL (www.pymol.org). The helices were colored using rainbow from N to C terminal, with hues from blue through cyan closer to N terminal, while red through yellow closer to C terminal. Therefore, The TM regions are traceable in each structure by following the colors. Specifically, in MFS fold family members (e.g. LacY, GlpT, XylE, PepTso and EmrD), cool colors and warm colors are falls into two bundles, meaning that N and C terminal are separated into two bundles. This Figure is reproduced in color in Molecular Membrane Biology online.

Table 1. Solute carrier family and the corresponding folds: solute carrier family and the corresponding function, folds and human diseases.

Table 2. Solute carrier family and the corresponding folds: categories of SLC structures based on folds.
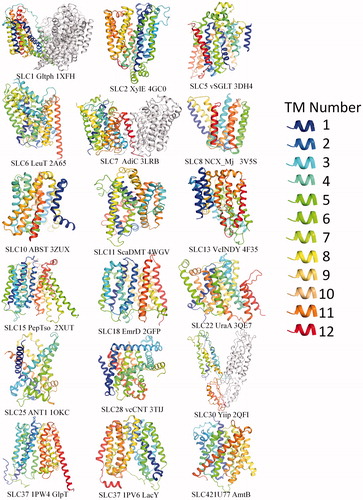
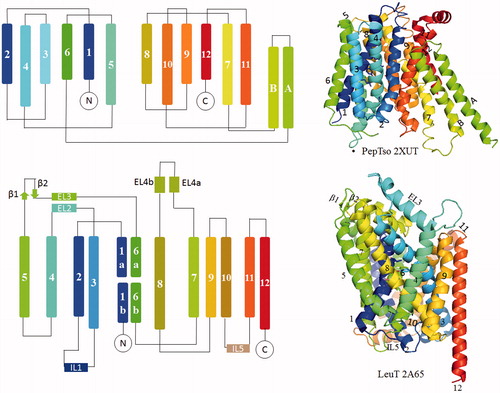
Figure 2. Left, topology diagrams of MFS fold representative protein PepTso and LeuT fold protein LeuT. Right, structures are shown as cartoon using PyMOL (www.pymol.org). This Figure is reproduced in color in Molecular Membrane Biology online.

Figure 2. Left, topology diagrams of MFS fold representative protein PepTso and LeuT fold protein LeuT. Right, structures are shown as cartoon using PyMOL (www.pymol.org). This Figure is reproduced in color in Molecular Membrane Biology online.

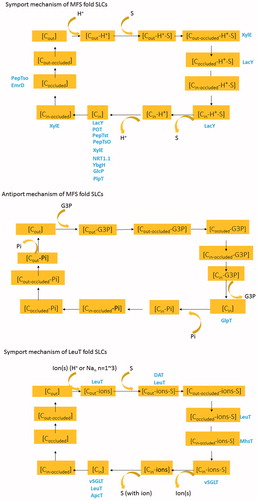
Figure 3. (A) Symport model of MFSs fold SLC proteins based on structures from sugar transporters (LacY, XylE), POT family proteins (POT, PepTst, PepTso, YbgH), NRT1.1, EmrD and PipT. Specifically, sequential release in PipT seems different from the other transporters by releasing the proton first, followed by exist of substrate. C: conformation. Cout: outward conformation. Cin: inward conformation. Cin-occluded: Occluded conformation. Protein structures captured in corresponding conformations were colored blue. (B) Antiport model of MFSs fold SLC proteins based on structures from GlpT. (C) Symport model of LeuT fold SLC proteins based on structures from LeuT, DAT, MhsT, ApcT and vSGLT. This Figure is reproduced in color in Molecular Membrane Biology online.

Figure 3. (A) Symport model of MFSs fold SLC proteins based on structures from sugar transporters (LacY, XylE), POT family proteins (POT, PepTst, PepTso, YbgH), NRT1.1, EmrD and PipT. Specifically, sequential release in PipT seems different from the other transporters by releasing the proton first, followed by exist of substrate. C: conformation. Cout: outward conformation. Cin: inward conformation. Cin-occluded: Occluded conformation. Protein structures captured in corresponding conformations were colored blue. (B) Antiport model of MFSs fold SLC proteins based on structures from GlpT. (C) Symport model of LeuT fold SLC proteins based on structures from LeuT, DAT, MhsT, ApcT and vSGLT. This Figure is reproduced in color in Molecular Membrane Biology online.

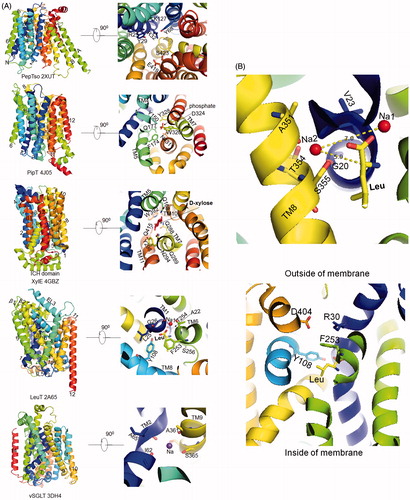
Figure 4. (A) Close-up view of the substrate/ion binding sites. Substrate binding sites of PepTso, PipT, XylE and LeuT and Na site of vSGLT were shown using Pymol. Bonds between atoms were not shown for clarity. For PepTso, since the presence of substrate is based on predictions from literature and map density, real substrate was not able to be shown here. (B) Top, Na2 site of LeuT. Distance between Na2 and Na1 (Leu substrate) were shown. Bottom, extracellular gate of LeuT. This Figure is reproduced in color in Molecular Membrane Biology online.

Figure 4. (A) Close-up view of the substrate/ion binding sites. Substrate binding sites of PepTso, PipT, XylE and LeuT and Na site of vSGLT were shown using Pymol. Bonds between atoms were not shown for clarity. For PepTso, since the presence of substrate is based on predictions from literature and map density, real substrate was not able to be shown here. (B) Top, Na2 site of LeuT. Distance between Na2 and Na1 (Leu substrate) were shown. Bottom, extracellular gate of LeuT. This Figure is reproduced in color in Molecular Membrane Biology online.

Reprints and Corporate Permissions

Please note: Selecting permissions does not provide access to the full text of the article, please see our help page How do I view content?

To request a reprint or corporate permissions for this article, please click on the relevant link below:

Academic Permissions

Please note: Selecting permissions does not provide access to the full text of the article, please see our help page How do I view content?

Obtain permissions instantly via Rightslink by clicking on the button below:

If you are unable to obtain permissions via Rightslink, please complete and submit this Permissions form. For more information, please visit our Permissions help page.