Figures & data
Figure 1. µ1B interacts and colocalizes in the perinuclear region with kAE1 in LLC-PK1 cells. (A), In LLC-PK1 (left panels) or MDCK (right panels) cell lysates containing either kAE1-myc only, µ1B HA only or kAE1-myc and µ1B-HA proteins, kAE1 was immunoprecipitated with rabbit anti-myc (kAE1) antibody before immunoblotting with anti-myc antibody to detect kAE1 and with anti-HA to detect μ1B protein. IP means immunoprecipitation. Open circle corresponds to kAE1 carrying complex oligosaccharides, and filled circle indicates kAE1 carrying high mannose oligosaccharides. µ1B migrates as a 50 kDa band. (B), For the proximity ligation assay, LLC-PK1 cells were transiently transfected with empty vector and μ1B as a negative control, kAE1 and CAII as a positive control, and with kAE1 and µ1B. Red dots appear when the two proteins are within 30–40 nm from each other. Nuclei were stained with DAPI (blue). Bar = 10 μm. (C), Immunofluorescence experiment showing colocalization between kAE1-myc and µ1B HA. Polarized LLC-PK1 cells expressing kAE1 and µ1B were fixed, permeabilized, blocked before incubation with an anti-myc antibody (kAE1) followed by anti-mouse antibody coupled to Alexa 488 (green) and anti-HA antibody (µ1B) followed by Cy5 coupled antibody (shown in red). Bar = 5 μm. The inset shows a region of the cell with yellow staining indicating colocalization.
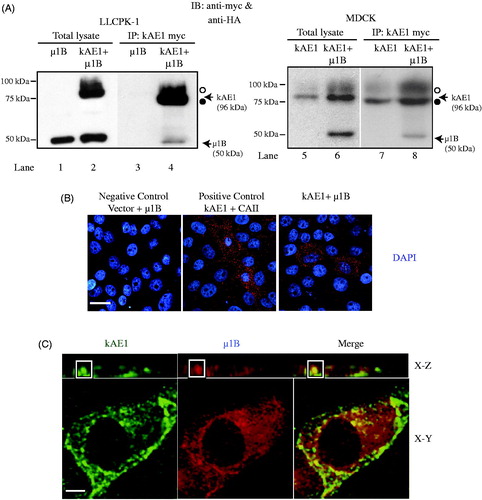
Figure 2. Phosphorylation of tyrosine 904 does not impair µ1B HA interaction with kAE1. MDCK cells expressing kAE1-myc and µ1B HA were either kept in control conditions (lane 1) or treated with pervanadate for 30 minutes (lane 2) prior to cell lysis and imunoprecipitation of kAE1 proteins. Eluted proteins were resolved by immunoblot and identified using an anti-HA antibody to detect µ1B, anti-kAE1 antibody to detect kAE1 and anti-phospho-tyrosine 904 antibody to detect phosphorylated kAE1. Open circle corresponds to kAE1 carrying complex oligosaccharides, and filled circle indicates kAE1 carrying high mannose oligosaccharides. This is representative of 3 independent experiments.
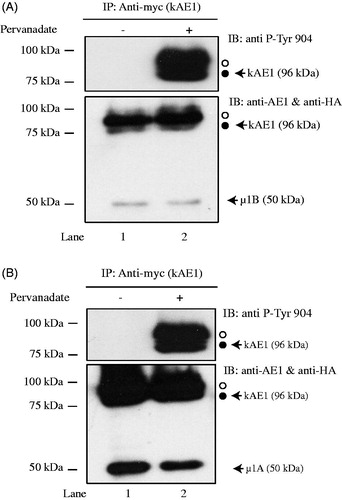
Figure 3. Expression of µ1B subunit displaces GAPDH interaction with kAE1 carboxyl-terminus. (A), MDCK cells expressing kAE1-myc and either vector cDNA (lane 1), cDNA-encoding µ1A-HA (lane 2) or µ1B-HA (lane 3) were lysed and kAE1 was immunoprecipitated with a rabbit anti-myc antibody. Proteins were then immunoblotted using mouse anti-myc antibody (kAE1), anti-HA antibody (µ1A or B) and anti-GAPDH antibody. (B), GAPDH and kAE1 band intensities were measured using ImageJ software and the ratio of GAPDH band intensity after expression of either µ1A or µ1B normalized to GAPDH band intensity in absence of µ1A or B was measured. Error bars correspond to SEM, from a minimum of 3 independent experiments. Star indicates significant difference versus corresponding vector-transfected cells.
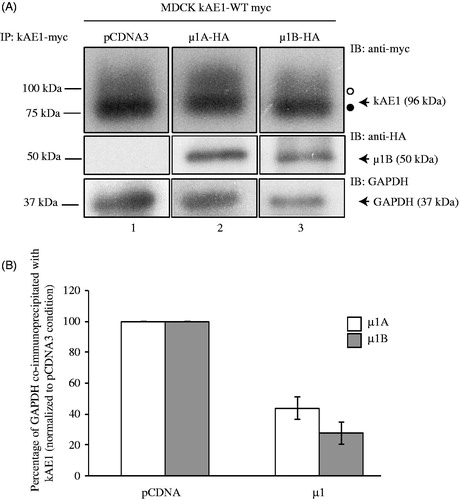
Figure 4. In polarized LLC-PK1 cells, kAE1 surface abundance decreases upon of µ1B expression. (A) Confluent LLC-PK1 cells expressing kAE1-HA only or kAE1 and µ1B-HA were incubated with membrane impermeant EZ-Link Sulfo-NHS-SS-Biotin reagent followed by streptavidin resin. Surface proteins were immunoblotted with mouse anti-HA antibody to detect kAE1 and µ1B. The immunoblot membranes were stripped and reincubated with rabbit anti-Na+/K+-ATPase to detect surface and total endogenous protein. (B), Histogram showing the ratio of surface to total kAE1 in cells expressing kAE1 only or with µ1B. Error bars correspond to SEM, from a minimum of 3 independent experiments. (C), Histogram showing the ratio of surface to total endogenous Na+/K+-ATPase in cells expressing kAE1 only or with µ1B. *p < 0.05 compared to vector-transfected cells. Error bars correspond to SEM from a minimum of 3 independent experiments. (D), Immunofluorescence experiment of polarized LLC-PK1 cells showing surface kAE1 in the presence and absence of µ1B. LLC-PK1 cells expressing kAE1 and µ1B-HA were grown on filters to polarization, then fixed and incubated with anti-myc antibody to detect surface kAE1 followed by a Cy3-coupled antibody (red). The cells were then permeabilized and incubated with anti-HA antibody to detect µ1B followed by an Alexa 488-coupled antibody (shown in blue). Total kAE1 was detected with an anti-myc antibody followed by a Dylight 649-coupled antibody (shown in green to facilitate observation). Bar =5 μm. (E), Histogram representing the percentage of surface kAE1 in the presence of µ1B relative to vector-transfected cells (see materials and methods). Mean fluorescence intensities for at least 50 cells for each condition from 3 independent experiments were measured using Volocity Image analysis software. Bars correspond to SEM. *p < 0.05 versus vector transfected cells.
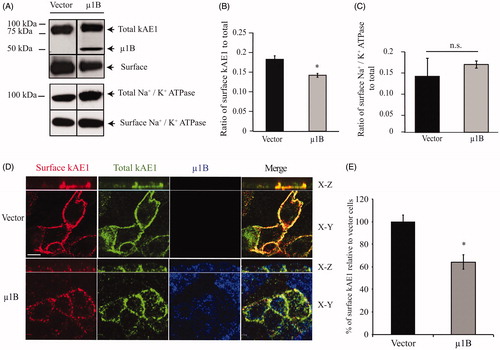
Figure 5. µ1B expression has no effect on kAE1 endocytosis rate. (A), Immunofluorescence experiment controlling for the efficacy of the acid wash. Polarized LLC-PK1 cells stably expressing kAE1-myc or both kAE1-myc and µ1B-HA were incubated with anti-myc antibody for 1 h at 4 °C, washed with acetate buffer (pH 3) for 10 min, then fixed and incubated with Cy3-coupled antibody (red) to detect surface antibodies after the acid wash. The cells were permeabilized, incubated with anti-HA antibody followed by Alexa488-coupled antibody to detect µ1B (shown in blue), and anti-myc antibody followed by Dylight649-coupled antibody to detect the total kAE1 (shown in green). Bar = 5 μm. (B), polarized LLC-PK1 cells stably expressing kAE1-myc or both kAE1-myc and µ1B HA were incubated with anti-myc antibody for 1 h at 37 °C cell incubator, then washed with acetate buffer (pH 3) prior to fixation, permeabilized and incubated with Cy3-coupled antibody (red). µ1B-HA was detected with anti-HA antibody followed by Alexa488-coupled antibody (shown in blue) and total kAE1 with an anti-myc antibody coupled to Dylight 649 (green). Bar = 5 μm. (C), Histogram representing percentage of endocytosed kAE1 in the presence of µ1B relative to vector-transfected cells. Mean fluorescence intensities were measured using Volocity image analysis program for at least 50 cells for each condition from 3 independent experiments. Bars correspond to means ± SEM. There was no significant difference between the 2 sets of values (n.s.).
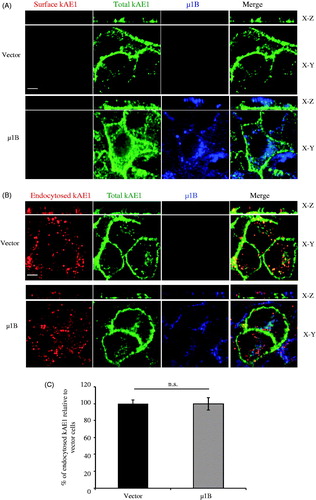
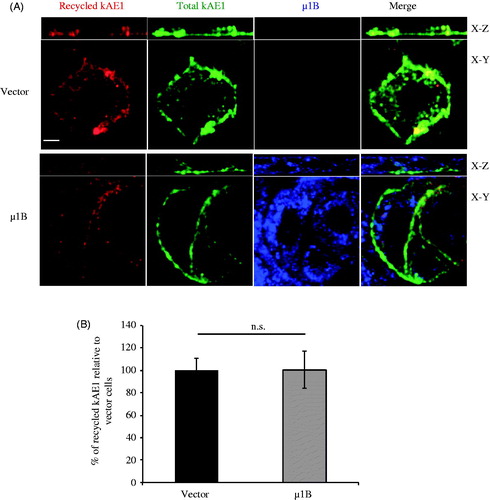
Figure 6. µ1B expression has no effect on kAE1 recycling rate. (A), Polarized LLC-PK1 cells stably expressing kAE1-myc or both kAE1-myc and µ1B-HA were incubated with anti-myc antibody for 1 h at 37 °C, then washed with acetate buffer (pH 3) prior to reincubation again at 37 °C for 90 min to induce protein recycling. The cells were fixed, incubated with Cy3-coupled antibody (red), permeablized before incubation with anti HA antibody followed by Alexa488-coupled antibody (shown in blue). Anti-myc antibody was added again followed by Dylight 649-coupled antibody to detect the total kAE1 (shown in green). Bar = 5 μm. (B), Histogram representing percentage of recycled kAE1 in the presence of µ1B relative to vector-transfected cells. Mean fluorescence intensities for at least 50 cells for each condition from 3 independent experiments were measured using Volocity image analysis program. Bars correspond to means ± SEM. There was no significant difference between the 2 sets of values (n.s.).