Figures & data
Figure 1. The Kdp K+-uptake system is closely regulated at the transcriptional level. The control is mediated by the sensor kinase KdpD and the response regulator KdpE, which are expressed constitutively. In an environment with K+ deficiency, KdpD phosphorylates KdpE, which then promotes transcription of the kdpFABC operon and expression of the KdpFABC complex.
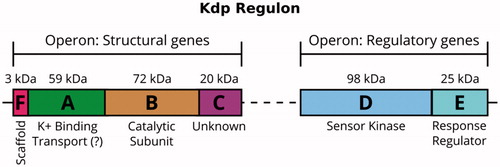
Figure 2. Generalized Post-Albers cycle for P-type ATPases. E1 and E2 represent conformations with ion-binding sites facing the cytoplasm and extracellular medium, respectively. X and Y are ionic species that are transported consecutively out of and into the cytoplasm with stoichiometries of ν and µ, respectively. (Xν)E1P, and E2(Yµ) represent occluded states in which the ions are bound within the membrane domain and are unable to exchange with either aqueous phase. E1P and E2P represent states in which a conserved catalytic aspartate residue is phosphorylated. In general, formation of this phospho-enzyme accompanies transport of the X ions out of the cytoplasm in the first half cycle, whereas dephosphorylation and transport of the Y ions into the cytoplasm occurs in the second half cycle.
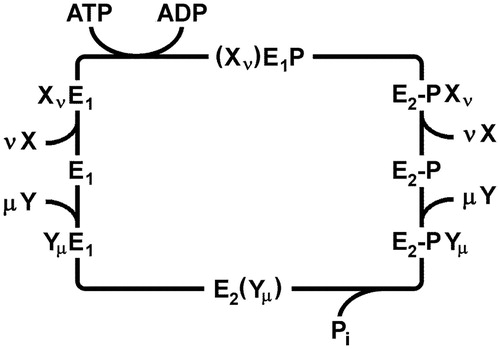
Figure 3. Monitoring K+ transport by the KdpFABC. (A) The florescent dye DiSC3(5) redistributes between the aqueous phase and the inner leaflet of the vesicle membrane as K+ transport out of the vesicle generates a negative electric potential. The resulting increase in dye concentration in the inner leaflet causes fluorescence quenching. Accordingly, when ATP was added to a vesicle suspension, K+ transport is reflected by decreasing fluorescence as shown in the lower panel. The initial rate of decrease can be used to quantify transport and the exponential shape reflects inhibition of transport as the potential increases. Experimental data were adopted from Damnjanovic et al. (Citation2013). Lipid vesicles are depicted as gray annuli, Kdp as a multicolored complex and DiSC3(5) molecules as 3 rings. (B) Electric currents are generated by the Kdp complex upon release of a small amount of ATP from caged ATP and can be measured with a black lipid membrane setup with proteoliposomes tightly (and thus capacitively) coupled to the black lipid membrane (BLM). The lower panel shows the time course of the electric current detected by electrodes placed on both sides (cis and trans) of the black lipid membrane. The sign of the transient current (which ceases within a few seconds) indicates transport of positive charge out of the liposomes. Experimental data were adopted from Fendler et al. (Citation1996), Copyright 1996 American Chemical Society. I(t) represents a current meter connected to cis and trans electrodes.
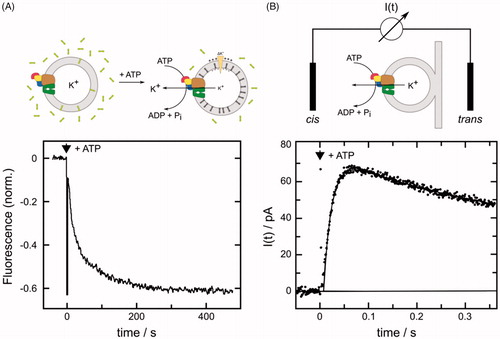
Figure 4. Electrogenic partial reactions of the KdpFABC complex monitored by RH421 fluorescence. (A) Fluorescence decrease induced by the release of ATP from caged ATP in the presence of a saturating concentration of K+. The red line represents the fit of an exponential function to the data. (B) The rate constant of the ATP-induced fluorescence decay was independent of the K+ concentration, thus indicating that the rate-limiting step occurred before ion binding. (C) The amplitude of the fluorescence decrease was dependent on K+ concentration with K1/2 of 6.8 ± 2.0 μM, which correlates with KM for the KdpFABC complex. The data were adapted from Damnjanovic and Apell (Citation2014b).
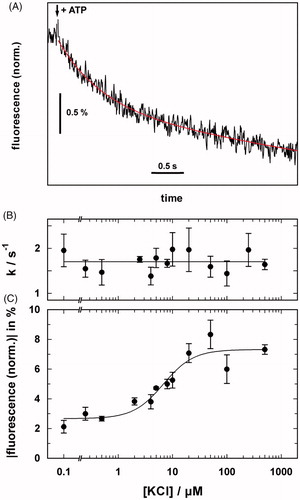
Figure 5. Conflicting Post-Albers reaction cycles based on functional and structural analyses of the KdpFABC complex. (A) Mechanism based on functional studies (Siebers & Altendorf, Citation1989; Damnjanovic & Apell, Citation2014b) that is in agreement with the “classical” cycle for P-type ATPases. In this case, K+ is imported in the dephosphorylating half cycle. These studies indicated that protons played an allosteric role during the transport cycle, but did not undergo transport across the membrane. (B) Mechanism based on structural studies (Haupt et al., Citation2004; Huang et al., Citation2017; Stock et al., Citation2018) in which K+ is transported in the phosphorylating half cycle.
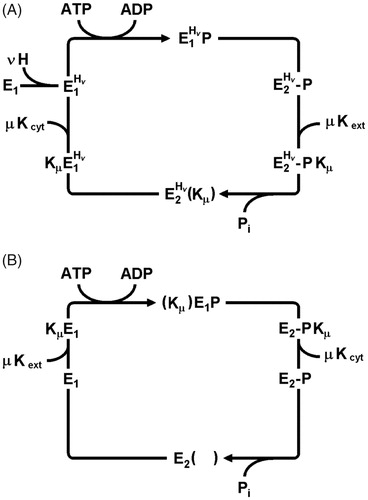
Figure 6. X-ray crystal structure of the KdpFABC complex in an E1-like conformation (PDB accession code 5MRW). (A) Overview of the structure, which had a resolution of 2.9 Å. The KdpF subunit (cyan) consists in a single membrane spanning helix at the interface of KdpA (green) and KdpB (transmembrane helices brown, P domain blue, A domain yellow, N domain red). KdpC (purple) consists of a single transmembrane helix and a periplasmic domain near the entrance to the selectivity filter of KdpA. (B) A cavity (blue surface) runs between the K+ ion (purple sphere) in the selectivity filter of KdpA and the water molecule in the canonical ion binding site in KdpB (occupied by a water molecule, red sphere). The cavity has a diameter ≥1.4 Å, which is consistent with its occupancy by water.
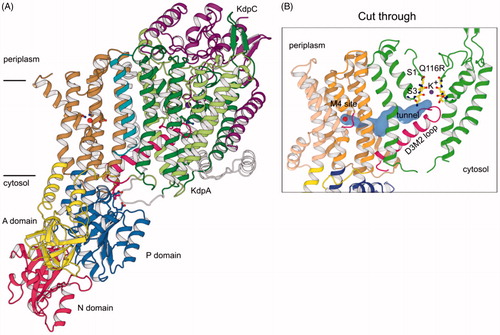
Figure 7. Phosphorylation and structural environment of Ser162. This residue is part of the conserved TGES motif in the A domain (yellow), which occupies different configurations in the three structures. (A) Crystal structure which represents the E1 enzymatic state. (B) State 1 structure from cryo-EM which also represents the E1 state. (C) State 2 from cryo-EM which represents the E2 state. The phosphor-serine, S162(P), mediates a salt bridge with two non-conserved residues in the N domain (red) in the X-ray structure. The A domain is known to be highly mobile and although its resolution in cryo-EM maps was not sufficient to see the phosphate, the juxtaposition of A and N domains in these two structures indicated that the salt bridge could not be formed. In state 2, E161 is seen approaching the catalytic aspartate (D307) in the P-domain (blue), which reflects its role in hydrolysis of the phosphoenzyme in the E2 state.
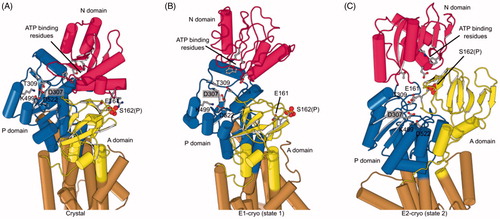
Figure 8. Comparison of KdpFABC structures. (A) X-ray crystal structure. (B) State 1 from cryo-EM. (C) State 2 from cryo-EM. Only minor changes were observed in KdpA, KdpC and KdpF. However, the arrangements of N, P and A domains of KdpB have significant differences in E1-like states and the E2-P state. The apparent loss of secondary structure in the N-domain from the cryo-EM state 1 is likely to be an artifact of the real-space fitting to the relatively low resolution densities in this region of that map.
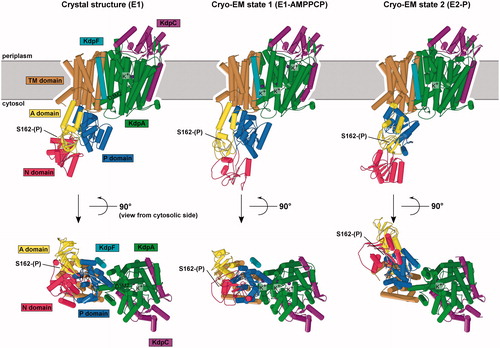
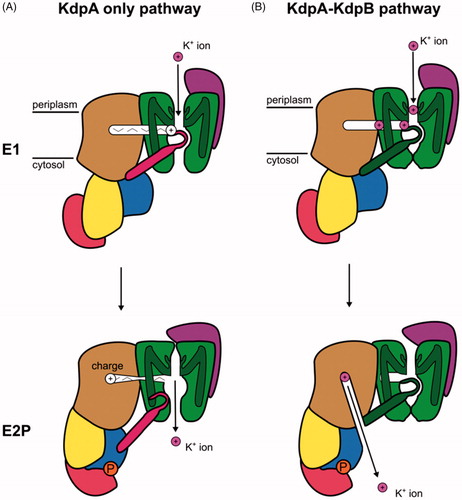
Figure 9. Schematic representation of the two mechanisms proposed for the KdpFABC complex based on structural studies. (A) Mechanism in which K+ travels through KdpA and the tunnel serves as a signaling conduit. K+ is bound from the periplasm in the selectivity filter of KdpA in the E1 conformation. A charge migrates through the tunnel and stimulates the ATPase cycle in KdpB. Conformational changes result in movement of the coupling helix (pink) that allows release of K+ to the cytoplasm in E2P. (B) Mechanism in which K+ travels from the periplasm to the selectivity filter and through the tunnel from KdpA to KdpB in the E1 conformation and is then released to the cytosol by KdpB in the P-E2 conformation.