Figures & data
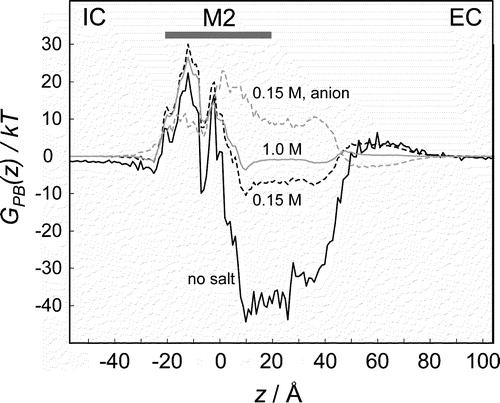
Figure 1. Modelling the intact α7 nAChR. The extracellular (A: EC; light grey) domain was homology modelled using the snail AChBP (PDB code 1I9B) as a template; the transmembrane (B: TM; dark grey) domain was homology modelled using the corresponding Torpedo cryo-electron microscopy structure (PDB code 1OED) as a template. These two domains were then combined (see Methods for details) to form a model of the intact receptor (C). The intracellular domain (IC), for which template coordinates are unavailable, is shown schematically as an ellipse, with arrows indicating the sideways entrance/exit of ions via the windows (dotted line ellipses) in the wall of this domain.
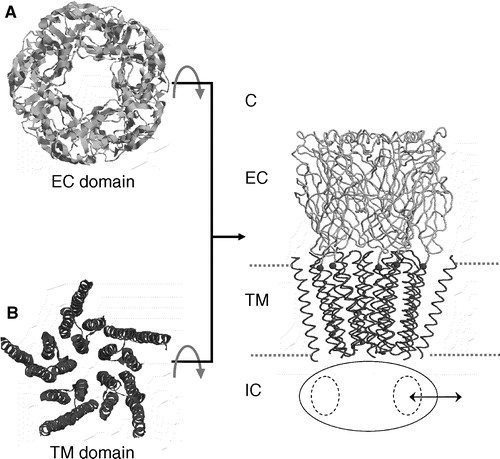
Figure 2. Alignment of (partial) sequences of the chick α7 nAChR (CHICK) and Torpedo marmorata α subunit nAChR (TORP) with the Lymnea stagnalis acetylcholine binding protein (ACHBP) sequence. The small vertical arrow indicates the boundary between the AChBP EC and nAChR TM templates, and the horizontal bar indicates the extent of the pore-lining M2 helices. The dotted line connects the two residues (K44 and D264 of the model) that formed the basis of the “other criteria” restraint (see Methods for details).
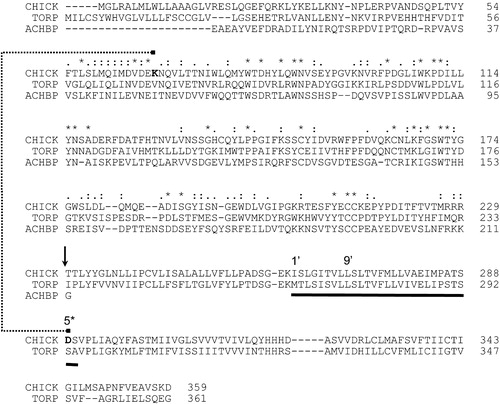
Figure 3. (A) Flow diagram of the procedure used to generate the α7 model. (B) Contour plot of a linear combination of three scoring functions (“chain termini”, “bad contacts”, and “other criteria”) as a function of translation and rotation of the EC domain relative to the TM domain. The scores are normalized from 0 (dark grey, corresponding to a “good” model) to 3.0 (white, corresponding to a “poor” model). The model used in subsequent calculations, i.e., with the optimal rotation and translation, is indicated by the white square.
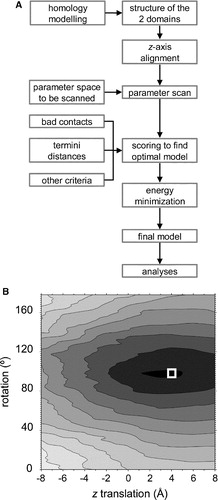
Figure 4. (A) Gaussian network model (GNM) results mapped onto the Cα trace of a single subunit, where each residue is coloured according to the calculated mobility (blue = low mobility, red = high mobility). Note that the calculations were on the pentameric assembly, but the results for a single subunit are shown for clarity. The two key residues (K68 of the EC domain and D289 of the TM domain) at the EC/TM domain interface are shown in spacefill format. The broken grey line is indicative of the unmodelled sequence between TM helices M3 and M4. (B) Predicted relative mobility (from the GNM) of residues as a function of residue number in the model; to convert to the alignment numbering scheme subtract 24).
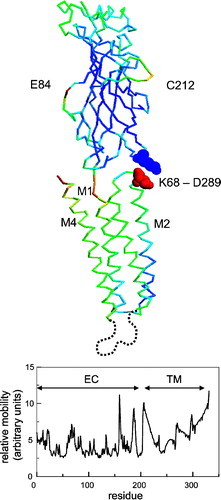
Figure 5. (A) Model of the α7 nAChR oriented such that the pore (z) axis coincides with that of the graphs in (B) and (C). The solid grey surface represents the pore lining surface, as calculated using HOLE (Smart et al. [Citation1996]). Note that the graphs in (B) and (C) are matched to the dimensions of (A) such that the minima in the pore radius plot (C) correspond to the constrictions of the pore lining surface in (A), as indicated by the two vertical arrows. (B) Comparison between PB energy profiles (for the intact α7 nAChR model, black broken line; and for just the M2 helix bundle, solid grey line) and MD-derived free energy profiles (PMFs for the α7 M2 helix bundle, solid black lines), calculated in the presence of 1 M NaCl. The PMFs calculated by equilibrium simulations (thin solid black line) and by umbrella sampling (thick solid black line) are shown (see Methods for details). The profiles are aligned with the pore lining residues from the M2 helices (indicated by the vertical dotted lines). Note that a negative z value corresponds to the intracellular mouth of the pore, and a positive value to the extracellular mouth of the pore. The M2 helices that line the pore extend from z ∼ −20 Å to z ∼ +20 Å. (C) Pore radius profile calculated for the intact α7 nAChR model using HOLE.
![Figure 5. (A) Model of the α7 nAChR oriented such that the pore (z) axis coincides with that of the graphs in (B) and (C). The solid grey surface represents the pore lining surface, as calculated using HOLE (Smart et al. [Citation1996]). Note that the graphs in (B) and (C) are matched to the dimensions of (A) such that the minima in the pore radius plot (C) correspond to the constrictions of the pore lining surface in (A), as indicated by the two vertical arrows. (B) Comparison between PB energy profiles (for the intact α7 nAChR model, black broken line; and for just the M2 helix bundle, solid grey line) and MD-derived free energy profiles (PMFs for the α7 M2 helix bundle, solid black lines), calculated in the presence of 1 M NaCl. The PMFs calculated by equilibrium simulations (thin solid black line) and by umbrella sampling (thick solid black line) are shown (see Methods for details). The profiles are aligned with the pore lining residues from the M2 helices (indicated by the vertical dotted lines). Note that a negative z value corresponds to the intracellular mouth of the pore, and a positive value to the extracellular mouth of the pore. The M2 helices that line the pore extend from z ∼ −20 Å to z ∼ +20 Å. (C) Pore radius profile calculated for the intact α7 nAChR model using HOLE.](/cms/asset/e3e25d82-735c-4f4b-bd50-97dce47ef0a6/imbc_a_106317_uf0005_b.jpg)
Figure 6. PB profiles of a monovalent cation (Na+) through the intact α7 nAChR channel at various ionic strengths (zero ionic strength = solid black line; 0.15 M NaCl = broken black line; 1.0 M = solid grey line). The PB profile is also shown for a monovalent anion (Cl−) in the presence of 0.15 M NaCl (broken grey line).