Figures & data
Figure 1. CD spectra of peptide F215-R246 in: (a) TFE at 100% (x), 95% (-), 80% (Δ), 50% (□), 20% (---); (b) SDS 5% (Δ), 2% (---), 1% (x), 0.1% (□); and of peptide W279-K305 in (c): TFE 100% (x), 95% (-), 80% (Δ), 50% (□), 20% (---); (d) SDS 5% (Δ), 2% (---), 1% (x), 0.1% (□). The data were expressed in terms of [Θ]R, the molar ellipticity per residue.
![Figure 1. CD spectra of peptide F215-R246 in: (a) TFE at 100% (x), 95% (-), 80% (Δ), 50% (□), 20% (---); (b) SDS 5% (Δ), 2% (---), 1% (x), 0.1% (□); and of peptide W279-K305 in (c): TFE 100% (x), 95% (-), 80% (Δ), 50% (□), 20% (---); (d) SDS 5% (Δ), 2% (---), 1% (x), 0.1% (□). The data were expressed in terms of [Θ]R, the molar ellipticity per residue.](/cms/asset/16a4a431-30a4-4576-94c2-924dc54fb616/imbc_a_106335_uf0001_b.jpg)
Figure 2. Summary of sequential and medium-range NOEs observed for peptide F215-R246 (a) and peptide W279-K305 (b) in 80% TFE at 25°C. The thickness of lines is related to the intensity of NOEs. Open bars indicate overlapping peaks. Asterisks under the amino acid one-letter codes indicate apparent 3JαH-NH coupling constants of non-Gly residues <6.0 Hz. Chemical Shift Index (CSI) of αH protons are shown below the bar diagrams for each peptide. Negative values indicate a helical conformation.
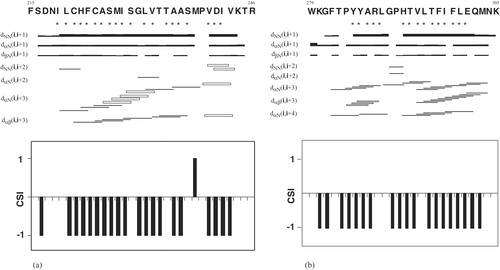
Figure 3. Left: Superposition of the fifty best structures of peptides F215-R246 (a) and W279-K305 (c), best-fitted on backbone atoms of residues L220-S237 and P284-M303, respectively. Structures are oriented with the N-terminus on the top of the figure. For peptide W279-K305 the side chains of Pro residues are arrowed, and are also shown in magenta colour online. For (a) the RMSD values are 0.90±0.32 Å on backbone atoms and 1.69±0.41 Å on heavy atoms and for (c) 0.81±0.32 Å on backbone atoms and 1.97±0.37 Å on heavy atoms, respectively. Right: Ribbon representations of the mean structure of the bundles of peptides F215-R246 (b) and W279-K305 (d). This Figure is reproduced in colour in Molecular Membrane Biology online.
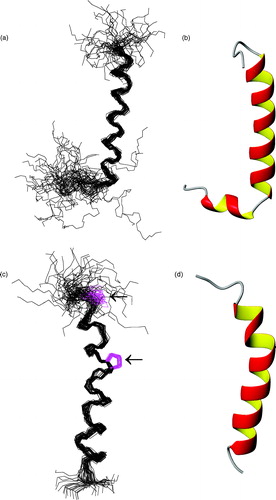
Figure 4. Quenching of intrinsic tryptophan fluorescence upon binding of TMSs to W279-K305. The spectra were recorded on a Fluorolog-3 spectrofluorimeter at an excitation wavelength of 295 nm. The fluorescence emission was recorded from 305 nm to 500 nm. (a) the spectra are W279-K305 alone (_) and then in presence of peptides: K21-K46 (KSVKFLFGGLAGMGATVFVQPLDLVK) (Δ), R78-R108 (RGIYTGLSAGLLRQATYTTTRLGIYTVLFER) (x), P117-A149 (PGFLLKAVIGMTAGATGAFVGTPAEVALIRMTA) (□), F215-R246 (---); (b) W279-K305 alone (_) and then in presence of 5 (---), 11 (□), 22 (Δ), 33 (•), 44 (x) and 55 (○) µM of F215-R246. The inset shows the fluorescence quenching of W279-K305 upon addition of different concentrations of F215-R246.
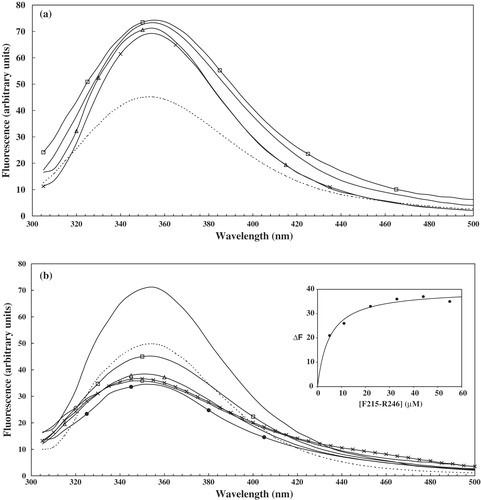
Figure 5. Summary of sequential and medium-range NOEs observed for peptide P257-L278 in 80% TFE at 25°C. The thickness of lines is related to the intensity of NOEs. Open bars indicate overlapping peaks. Asterisks under the amino acid one-letter codes indicate apparent 3JαH-NH coupling constants of non-Gly residues <6.0 Hz. Chemical Shift Index (CSI) of αH protons are shown below the bar diagrams. Negative values indicate a helical conformation.
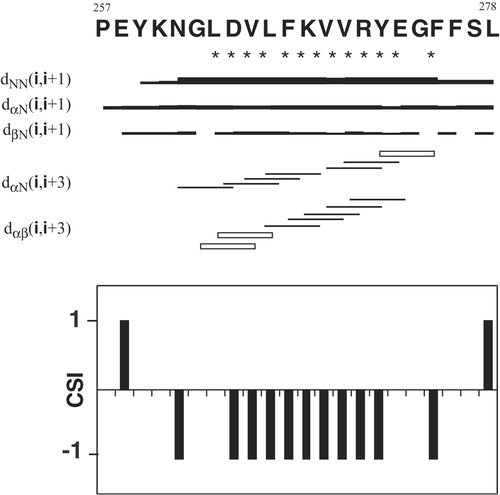
Figure 6. (a) Superposition of the fifty best structures of peptide P257-L278 best-fitted on backbone atoms of residues G262-F275. Structures are oriented with the N-terminus on the top of the figure. The RMSD values are 0.66±0.21 Å on backbone atoms and 1.93±0.36 Å on heavy atoms. (b) Ribbon representation of the mean structure of the bundle. This Figure is reproduced in colour in Molecular Membrane Biology online.
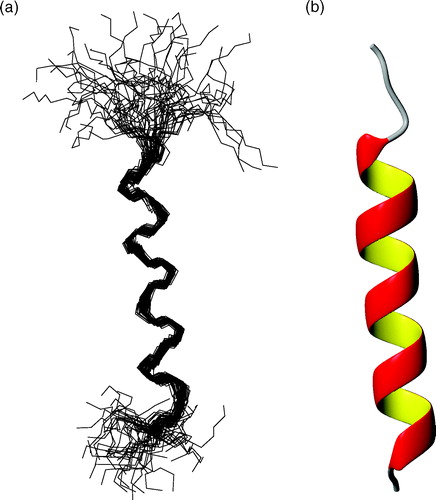
Figure 7. Helical wheel of peptides F215-R246, W279-K305 and P257-L278 obtained with the software ANTHEPROT (Deléage et al. [Citation1988]). Hydrophobic residues are shown in blue, the hydrophilic residues in red, cysteine residues in green and the others in grey.
![Figure 7. Helical wheel of peptides F215-R246, W279-K305 and P257-L278 obtained with the software ANTHEPROT (Deléage et al. [Citation1988]). Hydrophobic residues are shown in blue, the hydrophilic residues in red, cysteine residues in green and the others in grey.](/cms/asset/3762ee78-434b-4db2-b728-2afb2f28238e/imbc_a_106335_uf0007_b.jpg)
Figure 8. Superposition of backbone atoms of the mean structures of peptides F215-R246 (only residues L220-M238 are shown, in deep pink), W279-K305 (only P284-E301, in sky blue) and P257-L278 (only G262-E273, in yellow) on the corresponding amino acid sequences of helices H5 (residues 209–238), H6 (residues 273–290) and h56 (residues 253–264) in the crystal structure of the ADP/ATP carrier (Pebay-Peyroula et al. [Citation2003]) (PDB accession code: 1okc, in dark blue). Only the region of the ADP/ATP carrier, which is relevant for the comparison with the peptides studied in this paper, is shown for clarity.
![Figure 8. Superposition of backbone atoms of the mean structures of peptides F215-R246 (only residues L220-M238 are shown, in deep pink), W279-K305 (only P284-E301, in sky blue) and P257-L278 (only G262-E273, in yellow) on the corresponding amino acid sequences of helices H5 (residues 209–238), H6 (residues 273–290) and h56 (residues 253–264) in the crystal structure of the ADP/ATP carrier (Pebay-Peyroula et al. [Citation2003]) (PDB accession code: 1okc, in dark blue). Only the region of the ADP/ATP carrier, which is relevant for the comparison with the peptides studied in this paper, is shown for clarity.](/cms/asset/cd0c7b02-3236-4889-87ed-6866a36f3585/imbc_a_106335_uf0008_b.jpg)