Figures & data
Figure 1. Diagrams of the SLC2A11 gene structure and organization. Exons 1A, 1B, or 1C are spliced to the same splice acceptor site in exon 2 and generate four mRNAs encoding for GLUT11-A-C which differ in their N-terminal sequence. Positions of start (ATG) und stop (*) codons are indicated. Acc. numbers of ESTs encoding for the different isoforms are listed below each diagram.
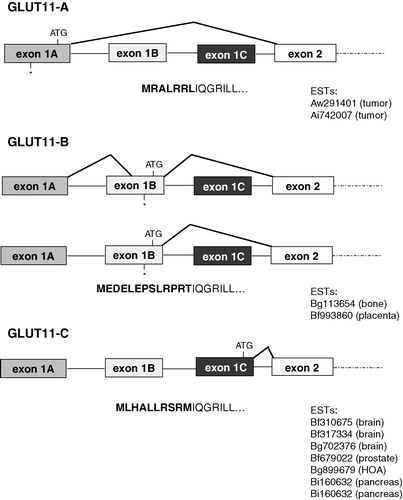
Table I. Tissue specific expression of GLUT11-A-C. (a) Number of 5′-RACE-PCR clones in human skeletal muscle and pancreas with a sequence corresponding to exon 1A, 1B, or 1C. (b) cDNA levels of GLUT11-A, -B and -C in pancreas and adipose tissue. Quantification of cDNA levels of GLUT11-A-C and RPL13A (control) were performed by real-time quantitative PCR. Amplification reactions were performed in triplicates. Results are presented as relative cDNA levels expressed as a percentage and depict a representative experiment that was repeated three times.
Figure 2. Northern blot analysis of the tissue distribution of GLUT11-A, -B, and -C. Northern blots with mRNA from the indicated human tissues were hybridized with (a) a GLUT11 cDNA probe specific for exon 1A (50811–51032 bp; genomic clone AP000350), (b) a GLUT11 cDNA probe specific for exon 1B (51340–51574 bp), and (c) a GLUT11 cDNA probe specific for exon 1C (51914–52073 bp).
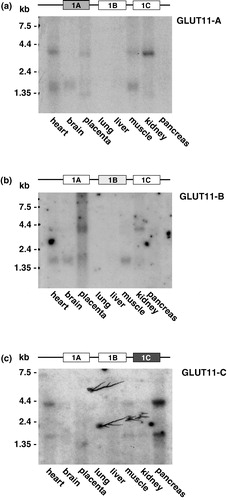
Figure 3. Specific expression of GLUT11 in human tissues. (a) Northern blots with mRNA from the indicated human tissues were hybridized as described with a cDNA probe of human GLUT11 (bp 1–624 and bp 952–1608; GenBank accession no. AJ271290). (b) Northern blot with the RNA of mouse heart was hybridized with a probe of the GLUT11 cDNA fragment 626–951 containing the α-MHC motif. (c) Northern blot with the RNA of mouse heart was hybridized with a probe corresponding to an EST of α-MCH (GenBank accession no. AA445445).
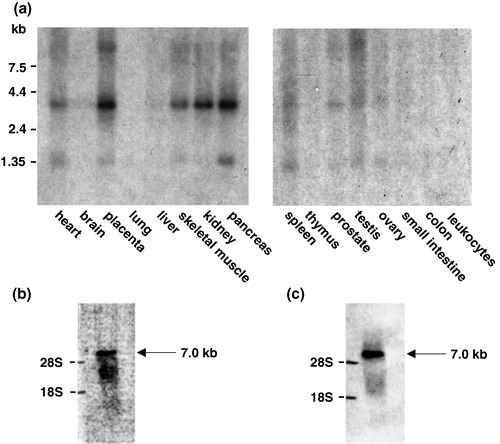
Figure 4. Analysis of different SLC2A11 promoters. (a) Comparison of the 5′-flanking regions of human SLC2A11 exon 1A, 1B, and 1C with the corresponding genomic sequence of the chimpanzee ortholog on chromosome 23. Homologous regions are marked as black lines and fragments used for luciferase assays are shown as arrows. The numbers refer to the positions in the gene, where +1 is the transcription initiation site of exon 1C, −680 that of exon 1B, and −1425 that of exon 1A. (b) Analysis of putative GLUT11-A-C promoter regions in 5′–3′ as well as in 3′–5′ orientation (indicated by *). Constructs of the 5′-flanking regions of exons 1A-C were generated by PCR and fused in both directions to the luciferase cDNA in the pGL3-basic vector by blunt-end ligation. COS-7 cells were transfected with these promoter-reporter constructs and luciferase activities were measured 48 h after transfection. Results represent means±SD of triplicate samples (transfections) from a representative experiment that was repeated three times. (c) Deletion analysis of the GLUT11-C promoter. Constructs of the 5′-flanking region of exon 1C were generated by PCR and fused to the luciferase cDNA in the pGL3-basic vector. COS-7 cells were transfected with these promoter-reporter constructs and luciferase activities were measured 48 h after transfection. Results represent means±SD of triplicate samples (transfections) from a representative experiment that was repeated three times.
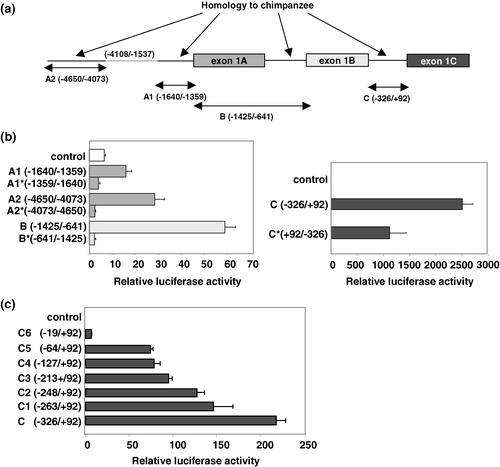
Figure 5. Sugar transport activity and substrate specificity of GLUT11-A-C. (a) Reconstituted glucose transport activity of GLUT11-A-C. COS-7 cells were transfected with cDNA of GLUT11-A, -B, and -C and membranes from COS-7 cells expressing the GLUT11 isoforms were reconstituted into lecithin liposomes and glucose transport activity was assayed at a D-glucose concentration of 5 mM. Data represent means±S.E. from a representative experiment. Co, control, membranes of cells transfected with the blank vector. (b) Substrate specificity of GLUT11-A-C detected in the Xenopus oocyte system. Xenopus oocytes were injected with the cRNA of GLUT11-A, -B, or -C or water 5 days before the uptake of radiolabeled substrates (100 µM) was measured. Filled bars represent total uptake of the indicated sugars, the open bars uptake detected for water-injected oocytes and the hatched bars represent the net uptake.
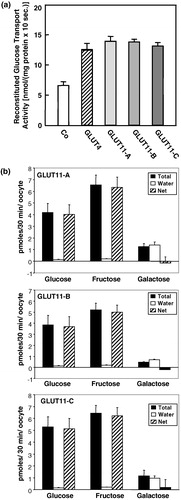
Figure 6. Subcellular distribution of GLUT11-A, -B, and -C overexpressed in COS-7 cells. (a) COS-7 cells were transfected with GLUT11-A and stained with preimmuneserum, with antiserum against a C-terminal peptide of GLUT11 (anti-GLUT11 antiserum), or the blocked antiserum and nuclei were co-stained with TO-PRO3. (b) COS-7 cells transfected with GLUT11-A-C were incubated in a serum free medium (upper panel) or in the presence of 10% FCS (lower panel) and stained with the anti-GLUT11 antiserum. In all experiments GLUT11 was detected with a FITC-labelled secondary antibody and visualized by confocal laser scanning microscopy. Thisfigure is reproduced in colour in Molecular Membrane Biology online.
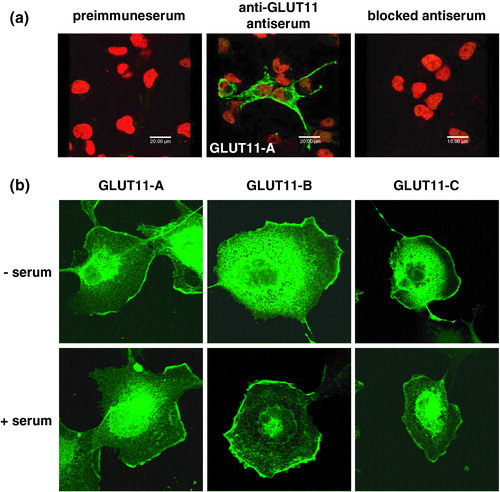
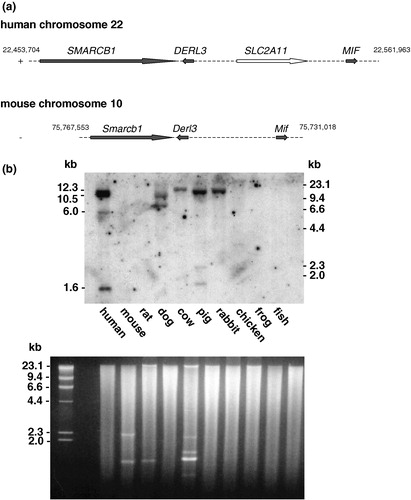
Figure 7. Conservation of SLC2A11 orthologs across vertebrates. (a) Genomic localization of SLC2A11 on human chromosome 22q11.23 and comparison of this region with the syntenic region of mouse chromosome 10. SMARCB1 encodes for integrase interactor 1 protein, DERL3 encodes for Derl-like domain family member 3, and MIF encodes for macrophage migration inhibitory factor. (b) A multiple-species Southern ‘zoo’ blot containing 10 µg of EcoR I-digested genomic DNA samples from representative species from class mammals (human, mouse, rat, dog, cow, and pig), bird (domestic chick, Gallus domesticus), frog (Xenopuslaevis), and from fish (catfish, Parasilurus asolus) was hybridized with a cDNA probe of human GLUT11 (bp 1–624 and bp 952–1608). Ethidium bromide stained gel used for Southern blotting is shown in the lower panel.