Figures & data
Figure 1. The analysis of the composition and specific enzyme activity of DOPC membranes into which were incorporated SERCA1 and AAA-PLB in an initial SERCA1/AAA-PLB molar ratio of 1:10 and an initial SERCA1:DOPC ratio of 1:160. The membranes were re-formed after removal of the detergent used in the reconstitution procedure. Optical densities were measured from 25 fractions taken from a sucrose density gradient after sedimentation of the re-formed membranes (a). Fractions with an optical density of more than 0.2 (shaded columns) were combined for further analysis. A 15% SDS-PAGE gel of the combined fractions (b, right lane) showed a band corresponding to molecular weights of between 6.5 and 14.2 kDa, which was consistent with monomeric AAA-PLB (denoted P), and a band above 66 kDa, which was consistent with SERCA1 (denoted S). The bands from marker proteins and their molecular weights are shown in the right lane. In (c) the calcium-dependent ATPase activity of the pooled fractions (circles) is compared with the ATPase activity of membranes prepared under identical conditions but in the absence of AAA-PLB (squares). The two plots are normalized to the activity of each membrane sample at the highest calcium concentration (0.8 µM). All experimental conditions are described in Methods and materials.
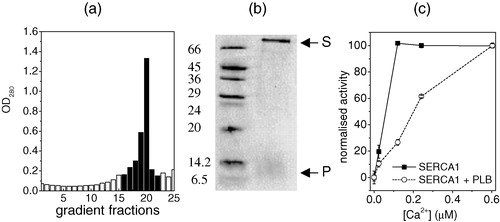
Figure 2. The results of 13C CP-MAS NMR experiments obtained from DOPC membranes containing [α-13C-L44]AAA-PLB with or without SERCA1. Regions of the NMR spectra of membranes containing SERCA1 at 253 K and 303 K are shown in (a) and (c). The peak of interest assigned to AAA-PLB is shaded for clarity. The spectrum of membranes without SERCA1 at 303 K is shown in (b). Each spectrum was collected after the accumulation of 4096 transients. Below the spectra are shown plots of the areas of the peak at 56 ppm assigned to AAA-PLB over the temperature range 253 K to 303 K. The intensity values corresponding to the spectra shown above the graph are denoted a–c. The sample spinning rate was 4 kHz.
![Figure 2. The results of 13C CP-MAS NMR experiments obtained from DOPC membranes containing [α-13C-L44]AAA-PLB with or without SERCA1. Regions of the NMR spectra of membranes containing SERCA1 at 253 K and 303 K are shown in (a) and (c). The peak of interest assigned to AAA-PLB is shaded for clarity. The spectrum of membranes without SERCA1 at 303 K is shown in (b). Each spectrum was collected after the accumulation of 4096 transients. Below the spectra are shown plots of the areas of the peak at 56 ppm assigned to AAA-PLB over the temperature range 253 K to 303 K. The intensity values corresponding to the spectra shown above the graph are denoted a–c. The sample spinning rate was 4 kHz.](/cms/asset/2c8bbfdd-a399-4395-a145-20cdaa7714cc/imbc_a_117507_uf0002_b.jpg)
Figure 3. Simulated plots of the dependence of H-C dipolar couplings on the residency time τres of [α-13C-L44]AAA-PLB bound to SERCA1 in lipid membranes. Simulated H-C dipolar curves showing the predicted 13C peak intensity at different fractions of one cycle of sample rotation are shown for residency times τres of 10 µs 500 µs and 10 ms (a). Each curve corresponds to an apparent value of the coupling strength (d appHC) The relationship between d appHC and τres is shown in (b).
![Figure 3. Simulated plots of the dependence of H-C dipolar couplings on the residency time τres of [α-13C-L44]AAA-PLB bound to SERCA1 in lipid membranes. Simulated H-C dipolar curves showing the predicted 13C peak intensity at different fractions of one cycle of sample rotation are shown for residency times τres of 10 µs 500 µs and 10 ms (a). Each curve corresponds to an apparent value of the coupling strength (d appHC) The relationship between d appHC and τres is shown in (b).](/cms/asset/f5c63834-292f-4d44-9d20-d3a89328edae/imbc_a_117507_uf0003_b.jpg)
Figure 4. Experimental H-C dipolar curves and simulations for [α-13C-L44]AAA-PLB in DOPC membranes containing SERCA1 in the molar ratios described in the legend to . Data points were collected at the temperatures stated. The solid lines represent the best fitting curves calculated by substitution of the appropriate τres value into the function summarized in Equation [2]. The dashed lines show the calculated dipolar curve for the rigid limit value of dHC in the absence of exchange. The sample spinning rate was 4 kHz.
![Figure 4. Experimental H-C dipolar curves and simulations for [α-13C-L44]AAA-PLB in DOPC membranes containing SERCA1 in the molar ratios described in the legend to Figure 1. Data points were collected at the temperatures stated. The solid lines represent the best fitting curves calculated by substitution of the appropriate τres value into the function summarized in Equation [2]. The dashed lines show the calculated dipolar curve for the rigid limit value of dHC in the absence of exchange. The sample spinning rate was 4 kHz.](/cms/asset/1328b413-0ccb-4a49-b8e3-722d6775b18d/imbc_a_117507_uf0004_b.jpg)
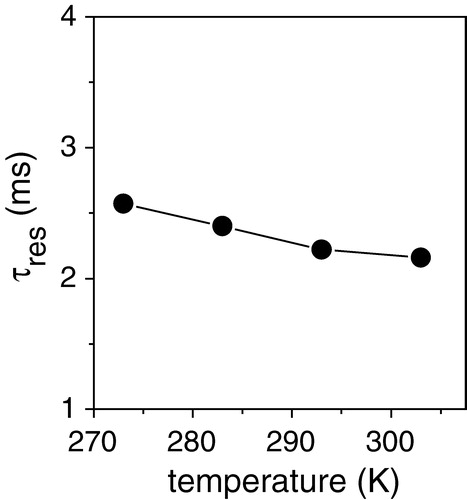
Figure 5. Measurements of the residency time τres for the association of AAA-PLB with SERCA1 at temperatures from 273 K to 303 K. Values of τres correspond to the curves in best agreement with the experimental data shown in .