Figures & data
Table I. The number of lipids and SPC solvent molecules present in each model. The molecules deleted were in direct atomic conflict with ARF1p. As can be observed, the ratios of DOPC:DOPG were not significantly altered; the original ratio of waters (SPC) per lipid molecule (20.1:1) was altered by <1%. The control bilayer (no peptide) contained 140 lipids in total (98 DOPC and 42 DOPG) together with 42 Na+ counter-ions and 2954 water molecules. The figures in parentheses indicate the number of molecules deleted in the peptide containing (upper) leaflet.
Figure 1. A schematic representation of the label positions in the NPT ensemble. Comparison is shown between each of the four simulated model, as well as experimental data (Davies et al. [Citation2003]).
![Figure 1. A schematic representation of the label positions in the NPT ensemble. Comparison is shown between each of the four simulated model, as well as experimental data (Davies et al. [Citation2003]).](/cms/asset/374953e0-1a37-40ca-8311-3bfd086968c2/imbc_a_121997_f0001_b.jpg)
Table II. The position and width of the three phenylalanine residues of ARF1p, deuterium labeled in the neutron study (Davies et al. 2003). The table provides a comparison between experimental data previously published and two of the simulated models. Both of these models were in the correct hydrophobic/hydrophilic orientation. The position of each label site is expressed as the distance from the centre of the bilayer. The width of each label site is expressed as 1/e in both experimental and simulation studies.
Figure 2. Snapshots of AFR1p in a mixed DOPC/DOPG bilayer. (A) Starting snapshot of Model A. (B) Starting snapshot of Model B. (C) Starting snapshot of Model C. (D) Starting snapshot of Model D. The peptide is displayed with a yellow colouring. The phenylalanine residues are represented with purple colouring. Water molecules and Na+ counter-ions are deleted for greater clarity. This figure is reproduced in colour in Molecular Membrane Biology online.
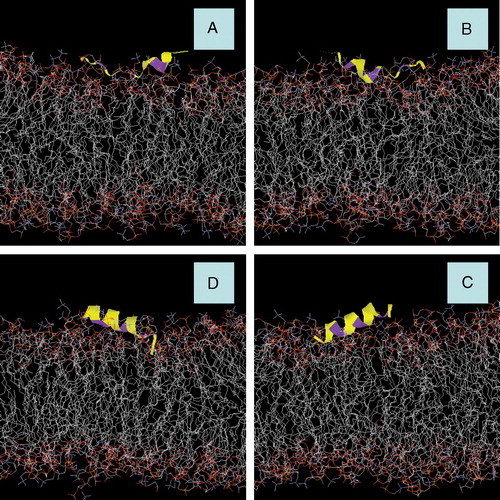
Figure 3. Snapshots of AFR1p in a mixed DOPC/DOPG bilayer. (A) Model A after 3.9 ns of MD simulation with an NPT ensemble. (B) Model B after 3.9 ns of MD simulation with an NPT ensemble. (C) Model C after 0.5 ns of MD simulation with an NPT ensemble. (D) Model D after 0.5 ns of MD simulation with an NPT ensemble. The peptide is displayed with a yellow colouring. The phenylalanine residues are represented with purple colouring. Water molecules and Na+ counter-ions are deleted for greater clarity.
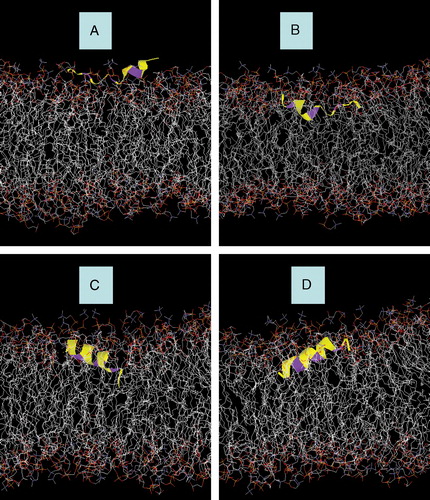
Figure 4. Total internal hydrogen bonding within ARF1p: (a) the stable hydrogen bonding pattern of the crystal structure of model A. There are no major fluctuations observed within this model. (b) the initial α-helical structure of model C. The initial hydrogen bonding pattern within this model was typical of an α-helix. However, as the simulation progresses, the number of hydrogen bonds was reduced to values closely associated with model A.
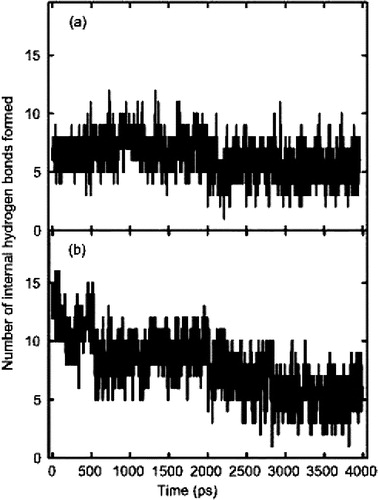
Figure 5. Solvent Accessible Surface (SAS) of models A and C. (a) model A which, due to a partially helical structure, had a lower SAS than model C. However, as can be seen the fluctuations of SAS were lowest in model A. (b) the SAS of model C. Initially the SAS of model C was higher, primarily due to the peptide's helical conformation. As the simulation progressed, the SAS of model C was reduced, due to a decrease in helical content.
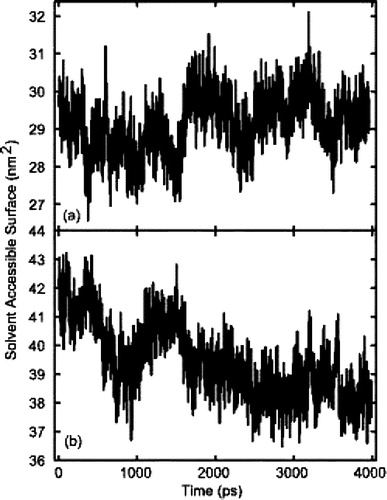
Figure 6. Ramachandran plot of certain amino acid residues in models A and C. (a) The penultimate lysine residue in model C, between 0 and 1 ns of simulation. This residue was initially (arrow), but rapidly developed a non-helical conformation. (b) The same residue between 3–4 ns of simulation. There is no indication of helicity within this time frame. (c) The penultimate residue (Lys-13) in model A between 0 and 1 ns. As can be observed no helicity is present in the starting structure. (d) The same residue between 3 and 4 ns of simulation. The conformation is still predominantly non-helical, although there are minor fluctuations in phi/psi these are still outside the α-helical region of the Ramachandran plot. (d) A complete 0–4 ns Ramachandran plot of a residue from the α-helical region of the peptide (Ile-3) in model C. The conformation remains predominantly helical throughout the 4 ns simulation period. (e) The corresponding isoleucine residue in model A, which also maintains its predominantly helical conformation throughout the 4 ns of simulation.
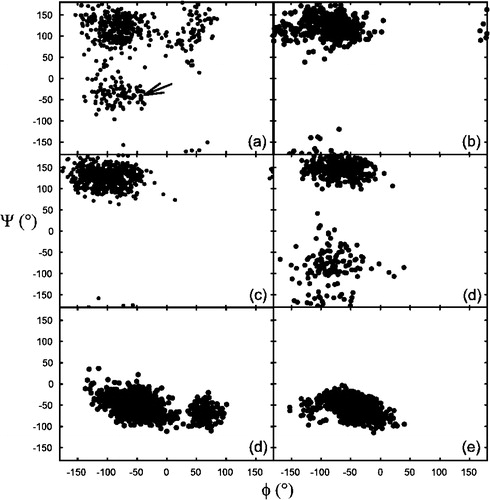
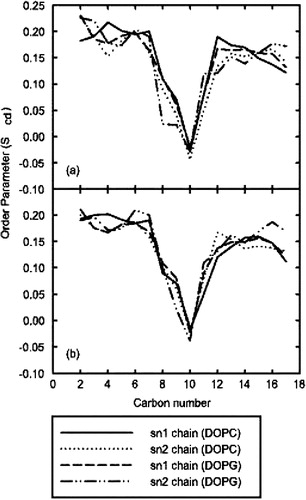
Figure 7. Order parameters of oleoyl chains in model A. (a) the deuterium order parameters calculated for the top leaflet of the membrane, which contained ARF. (b) the lower leaflet, which was unperturbed from the pre-equilibrated bilayer. As can be seen, no significant changes in order parameters occurred as a result of peptide insertion.