Figures & data
Figure 1. Oxidative stress effect on normal and g6pdd RBC. Normal (lanes a, c) and G6PDd (lanes b, d) erythrocytes incubated in the absence (lanes a, b) and presence (lanes c, d) of 0.3 mmol L−1 diamide. Membranes (10 µg), recovered as described in Methods, were analysed by Western blotting and immunostained with anti-P-Tyr (panel A), anti-Syk (panel B), or anti-SHP-2 (panel C) antibodies. Panel D: corresponding anti-actin immunostaining for loading control. Figure is representative of eight separate experiments.
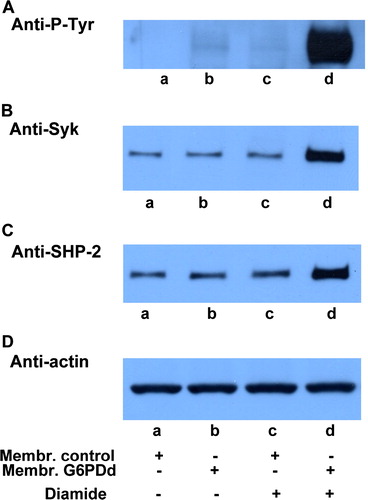
Figure 2. Effect of increasing diamide concentration on membrane band 3 Tyr-phosphorylation (panel A) and Syk recruitment to membranes (panel B). Normal (▪) and G6PD-deficient (▴) erythrocytes incubated with 0, 0.3, 0.5, 1 and 1.5 mmol L−1 diamide, respectively. Membranes (10 µg) recovered as described in the Methods, were analyzed by Western blotting and immunorevealed with anti-P-Tyr (panel A), anti-Syk (panel B) or anti-SHP-2 (not shown but represented by panel B) antibodies, and the corresponding stains were counted in a densitometer. For the band 3-Tyr-P evaluation an arbitrary unit was chosen, whereas for enzyme recruitment, the amount of each enzyme in resting cells was used as 100% value. Results are mean of three separate experiments, with three normal and three deficient erythrocytes.
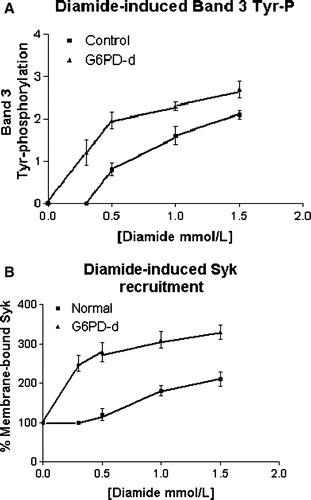
Figure 3. Quantitative comparison of enzyme amount and distribution. Normal (lanes a, c) and G6PDd (lanes, b, d) erythrocytes were processed and membranes (lanes a, b) were separated from the cytosol (lanes c, d) as described in Methods. 10 µL of membranes or 30 µL cytosol were successively analysed by Western blotting and immunorevealed with anti-Syk (panel A), anti-SHP-2 (panel B) or anti-Lyn (panel C). Panel D: shows the corresponding anti-actin immunostaining for the loading control. Figure is representative of at least ten separate experiments.
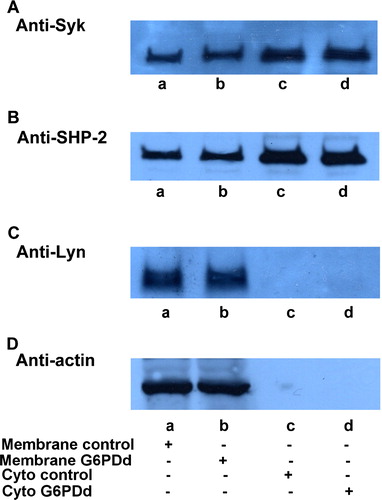
Figure 4. Tyrosine Kinase and tyrosine Phosphatase activities in normal and G6PDd human erythrocytes.(A) Tyr-protein kinase activity. Normal (lanes a, c) and G6PDd (lanes b, d) erythrocytes subjected to a few freeze/thaw cycles and membranes were separate from cytosol by microfuge as described in Methods. Then 2 µL of membranes (lanes a, b) and 2 µL of cytosol (lanes c, d) were incubated in basal medium of phosphorylation containing γ[32P] ATP in presence of cdb3 as described in Methods and samples were submitted to SDS PAGE. Gel was stained with Coomassie blue, subjected to 2 mol L−1 NaOH treatment, dried and autoradiographed for 2 days. Panels are representative of eight distinct experiments.(B) Tyr-protein phosphatase activity. 2 µL of membranes (lanes a, b) and 2 µL of cytosol (lanes c, d) from normal (lanes a, c) and G6PDd (lanes b, d) erythrocytes were incubated in basal medium of dephosphorylation in presence of [32P]cdb3. Lane C: the control pattern of the loaded [32P]cdb3. Samples were submitted to SDS PAGE. Gel was stained with coomassie blue and then treated with 2 mol L−1 NaOH, dried and autoradiographed for 2 days. Panels are representative of 10 separate experiments.
![Figure 4. Tyrosine Kinase and tyrosine Phosphatase activities in normal and G6PDd human erythrocytes.(A) Tyr-protein kinase activity. Normal (lanes a, c) and G6PDd (lanes b, d) erythrocytes subjected to a few freeze/thaw cycles and membranes were separate from cytosol by microfuge as described in Methods. Then 2 µL of membranes (lanes a, b) and 2 µL of cytosol (lanes c, d) were incubated in basal medium of phosphorylation containing γ[32P] ATP in presence of cdb3 as described in Methods and samples were submitted to SDS PAGE. Gel was stained with Coomassie blue, subjected to 2 mol L−1 NaOH treatment, dried and autoradiographed for 2 days. Panels are representative of eight distinct experiments.(B) Tyr-protein phosphatase activity. 2 µL of membranes (lanes a, b) and 2 µL of cytosol (lanes c, d) from normal (lanes a, c) and G6PDd (lanes b, d) erythrocytes were incubated in basal medium of dephosphorylation in presence of [32P]cdb3. Lane C: the control pattern of the loaded [32P]cdb3. Samples were submitted to SDS PAGE. Gel was stained with coomassie blue and then treated with 2 mol L−1 NaOH, dried and autoradiographed for 2 days. Panels are representative of 10 separate experiments.](/cms/asset/d9141841-5c57-4d34-8685-fe1045fdd7e4/imbc_a_123350_f0004_b.jpg)
Figure 5. Hyperosmosis-induced membrane band 3 Tyr-phosphorylation in normal and G6PD deficient erythrocytes. Normal (lanes a, c) and G6PDd (lanes b, d) erythrocytes were incubated in isosmotic (lanes a, b) or hyperosmotic (lanes c, d) conditions. Membranes (10 µg), recovered as described in Methods, were analysed by Western blotting and immunorevealed with anti-P-Tyr (panel A), anti-Syk (panel B), anti-SHP-2 (panel C) antibodies. Panel D: corresponding anti-actin immunostaining for the loading control. Panels are representative of eight distinct experiments.
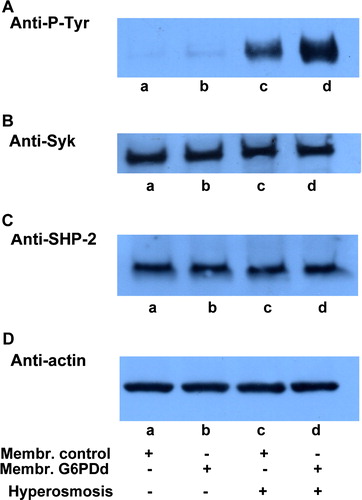
Figure 6. Effect of CDNB induced depletion of GSH on diamide treatment.Normal (lanes a–c) and G6PDd (lanes d) erythrocytes were pre-treated in presence (lanes b, c) or absence (lanes a, d) of 1 mmol L−1 CDNB, followed by incubation in presence (lanes c, d) or absence (lanes a, b) of 0.3 mmol L−1 diamide as described in Methods. Membranes (10 µg) were analysed by Western blotting and immunorevealed with anti-P-Tyr (panel A), anti-Syk (panel B), or anti-SHP-2 (panel C) antibodies. Panel D: corresponding anti-actin immunostaining for loading control. Panels are representative of eight distinct experiments.
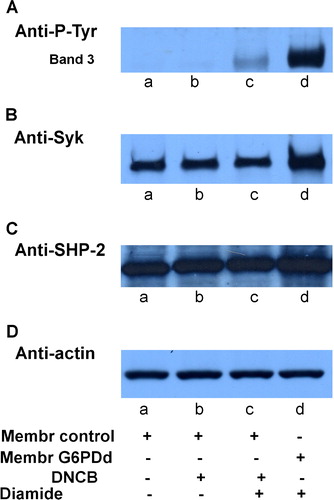
Table I. Total glutathione and GSSG content in normal and G6PD-deficient erythrocytes subjected to various treatments. Erythrocytes, incubated as indicated, were haemolysed, cytosol recovered and determination of total glutathione (GSSG + GSH) mmol L−1 and oxidized glutathione (GSSG) mmol L−1 determined, all as described in Methods. Mean±SD of six experiments.
Figure 7. Effect of epiandrosterone-induced G6PD activity inhibition on diamide treatment. Normal (lanes a–c) and G6PDd (lanes d) erythrocytes were pre-treated in presence (lanes b, c) or absence (lanes a, d) of 0.4 mmol L−1 epiandrosterone, followed by incubation in presence (lanes c, d) or absence (lanes a, b) of 0.3 mmol/diamide as described in Methods. Membranes (10 µg) were analysed to Western blotting and immunorevealed with anti-P-Tyr (panel A), anti-Syk (panel B) or anti-SHP-2 (panel C) antibodies. Panel D: corresponding anti-actin immunostaining for loading control. Panels are representative of eight distinct experiments.
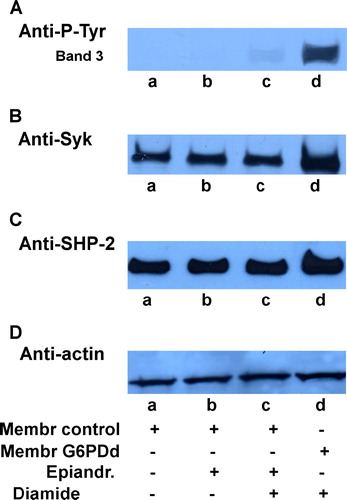
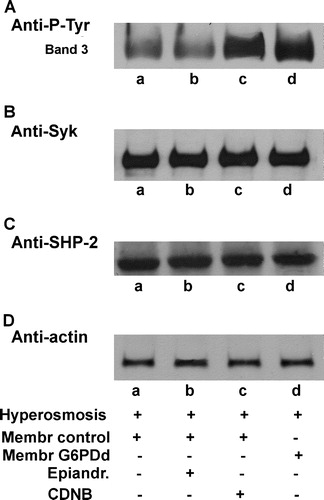
Figure 8. Effect of CDNB and/or epiandrosterone pre-treatment on the hyperosmosis-induced membrane band 3 Tyr-phosphorylation. Normal (lanes a–c) and G6PDd (lane d) erythrocytes were pre-treated in absence (lanes a, d) or presence of 0.4 mmol L−1 epiandrosterone (lane b), or 1 mmol L−1 CDNB (lane c), and then incubated in hyperosmotic medium (lanes a–d) as described in Methods. Membranes (10 µg), were analysed by Western blotting and immunorevealed with anti-P-Tyr (panel A) anti-Syk (panel B), or anti-SHP-2 (panel C) antibodies Panel D: corresponding anti-actin immunostaining for loading control. Panels are representative of eight distinct experiments.