Figures & data
Figure 1. UV Circular dichroism spectra of Cys-less and single tryptophan mutants. Cys-less: black dashed line; Cys184Trp: grey dashed line; Arg190Trp: black solid line; Leu199Trp: grey solid line. Protein concentration is 8 µM in DM buffer, pH = 7.1.
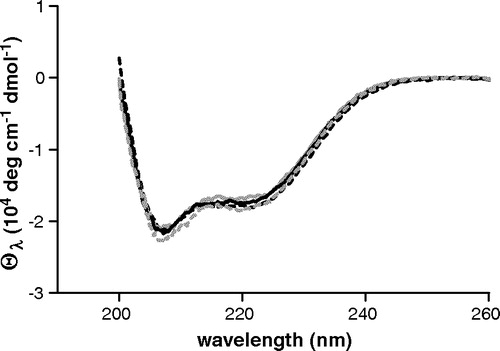
Figure 2. Panel A: Fluorescence spectra of single tryptophan OGC mutants in detergent solubilized form. Cys184Trp: grey dashed line; Arg190Trp: black solid line; Leu199Trp: grey solid line. Excitation wavelength is 295 nm. Protein concentration is 20 µM in DM buffer, pH = 7.1. Panel B: Percentage of the peak fluorescence emission intensities as a function of added compound concentration. Solid symbols represent titration with oxoglutarate. Triangles: Cys184Trp; wedges: Arg190Trp; squares: Leu199Trp. Data for non specific binding in the presence of citrate are shown for Leu199Trp mutant in open diamonds. The curves represent the fit of the experimental data considering a one-site binding model.
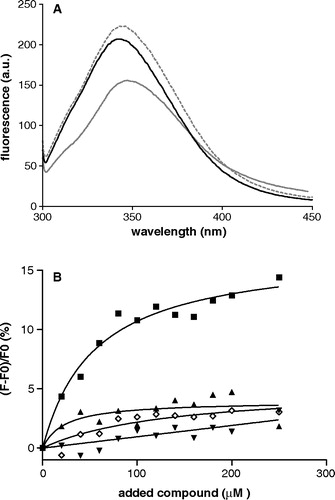
Figure 3. Flow chart of our modelling procedure. The transmembrane topology of the bovine oxoglutarate carrier (M2OM_BOVIN) is predicted with ENSEMBLE. The output is then aligned in an expert-driven way with the template sequence (bovine AAC), constraining the transmembrane helical positions and the conserved sequence motifs, as explained in the text. For each given alignment a set of ten 3D models is built by threading the sequence onto the template structure. Each new model is evaluated with the PROCHECK/PROSAII suite and only the best evaluated models are retained for further minimization and removal of conflicting positions.
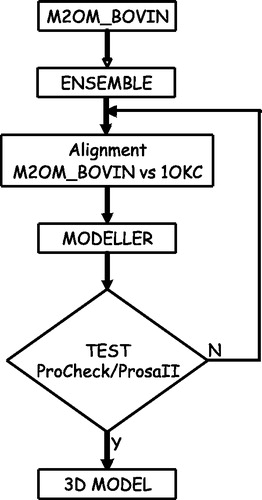
Figure 4. Sequence alignment of OGC and AAC, indicated with M2OM and 1OKC, respectively. The alignment emphasizes the threefold repeated sequence, and secondary structure is highlighted in bold and labeled on top, following Pebay-Peyroula et al. ([Citation2003]). Conserved motifs are also pointed out.
![Figure 4. Sequence alignment of OGC and AAC, indicated with M2OM and 1OKC, respectively. The alignment emphasizes the threefold repeated sequence, and secondary structure is highlighted in bold and labeled on top, following Pebay-Peyroula et al. ([Citation2003]). Conserved motifs are also pointed out.](/cms/asset/f993767f-beab-42ff-b607-24e78d726eeb/imbc_a_126916_f0004_b.jpg)
Figure 5. Panel A: The 3D model of OGC depicted with RasMol. Transmembrane and matrix exposed helices are colour-coded and the limiting residues are highlighted on the right in the same colours. Panel B: Superposition of the three structural repeats of the OGC model. The threefold repeat alignment is shown at the bottom with helical motifs. MCF motifs and conserved glycines are highlighted in red. RMSD of the C-α traces is ≤ 2 Å.
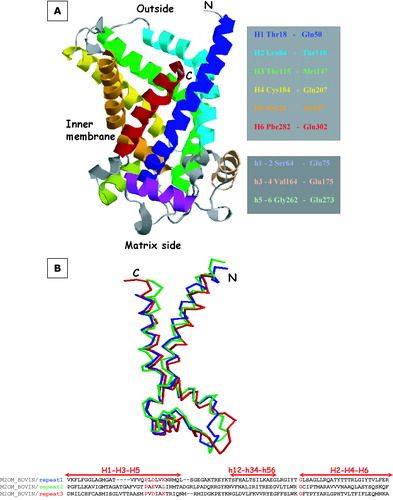
Figure 6. 3D view of Trp199 and Lys122 in the OGC model. The protein is seen from the cytoplasmic side and secondary structure elements are shown in cartoons. The two selected residues are depicted in sticks and their molecular surface is outlined in white. This figure is reproduced in colour in Molecular Membrane Biology online.
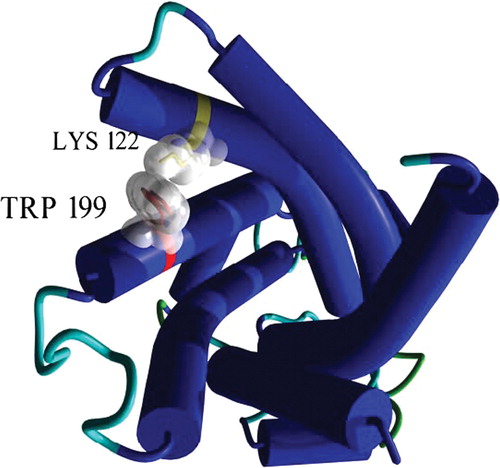
Figure 7. Fluorescence spectra of Lys122Ala-Leu199Trp and Leu199Trp mutants are plotted as solid and dashed lines respectively. Excitation wavelength is 295 nm. Protein concentration is 20 µM in DM buffer, pH = 7.1.
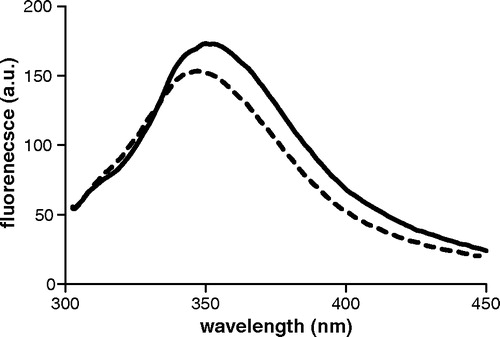
Figure 8. Influence of substrate on the inhibition of mutant Lys122Cys by MTSES. Proteoliposomes were preincubated for 10 min with 2.5 µM MTSES, in the presence (black bar) or absence (grey bar) of 0.2 mM oxoglutarate. Transport was initiated by adding 3 mM [14C] oxoglutarate and terminated after 1 min. Results are expressed as percent residual activity with respect to the control value without inhibitor. The data represent means±SD of four independent experiments in duplicate.
![Figure 8. Influence of substrate on the inhibition of mutant Lys122Cys by MTSES. Proteoliposomes were preincubated for 10 min with 2.5 µM MTSES, in the presence (black bar) or absence (grey bar) of 0.2 mM oxoglutarate. Transport was initiated by adding 3 mM [14C] oxoglutarate and terminated after 1 min. Results are expressed as percent residual activity with respect to the control value without inhibitor. The data represent means±SD of four independent experiments in duplicate.](/cms/asset/b6e86724-cfa7-42f1-93bc-56a04a7c4747/imbc_a_126916_f0008_b.jpg)