Figures & data
Figure 1. Activation of the SAKCa channel by TNP and CPZ. Effect of TNP (left) and CPZ (right) on whole-cell currents from a cell transfected with GFP alone (A) or with SAKCa/GFP (B). Cell membrane potential was held at −40 mV and stepped to various potentials for 1 sec duration from −80 to +80 mV in 10 mV increments. Each pair of recordings was from the same cell. (C) Current–voltage relationships corresponding to the above recordings.
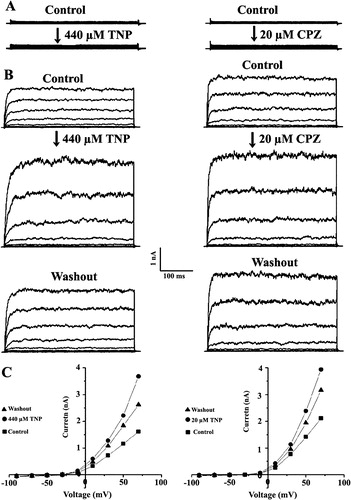
Figure 2. Dose-dependent activation of the SAKCa channel by TNP and CPZ. Representative whole-cell current traces from the same cell corresponding to the addition of TNP from 27 µM to 440 µM (A) or CPZ from 10 µM to 20 µM (B). The I-V curves before and after addition of TNP and CPZ were obtained with a voltage ramp of 1 s in duration starting from −80 to +80 mV.
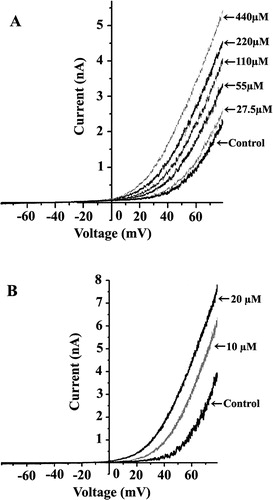
Figure 3. Conductance–voltage (G–V) curves for the TNP (A) and CPZ (B) activation of the channel. Each point represents mean±S.E. from at least five experiments. The G–V curves were fitted with the Boltzmann distribution G/Gmax=1/[1 + exp((V−V1/2)/k)], where k is a factor affecting the steepness of the relationship, and V1/2 is the voltage at which the conductance (G) is half the maximum conductance (Gmax). The error bars for each data point between the control and the maximal concentration of TNP and CPZ are omitted for clarity.
![Figure 3. Conductance–voltage (G–V) curves for the TNP (A) and CPZ (B) activation of the channel. Each point represents mean±S.E. from at least five experiments. The G–V curves were fitted with the Boltzmann distribution G/Gmax=1/[1 + exp((V−V1/2)/k)], where k is a factor affecting the steepness of the relationship, and V1/2 is the voltage at which the conductance (G) is half the maximum conductance (Gmax). The error bars for each data point between the control and the maximal concentration of TNP and CPZ are omitted for clarity.](/cms/asset/f9e39621-6f2a-4b8b-88b2-307ecd81b989/imbc_a_137053_f0003_b.jpg)
Figure 4. Compensatory effect between TNP and CPZ on the whole cell SAKCa current. (A) The TNP activated current was compensated by the CPZ. (B) The CPZ activated current was compensated by the TNP. Numbers in the parentheses indicate sequence of treating the same cell with the drugs: (1) for the SAKCa current without addition of any drug, (2) for addition of TNP (A) or CPZ (B) that was followed by (3) for addition of CPZ (A) or TNP (B).
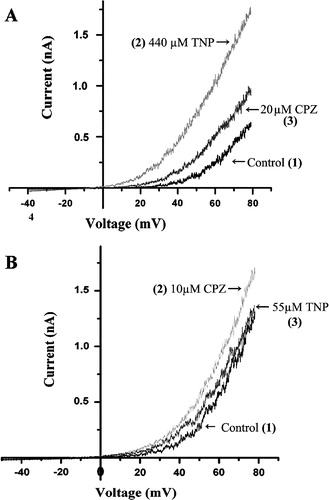
Figure 5. Effect of TNP and CPZ on whole cell current of the STREX deleted SAKCa channel. Effect of only 55 and 440 µM TNP (A) as well as 10 and 20 µM CPZ (B) on the whole cell current is shown for clarity. Each curve is an average from three traces when the currents were stable. n=3 or more.
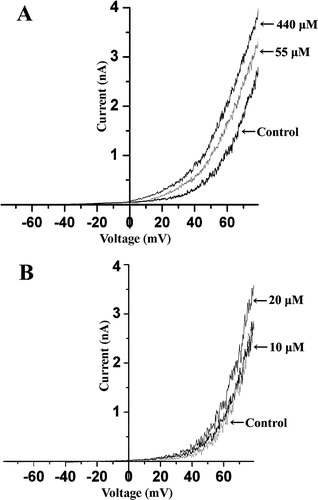
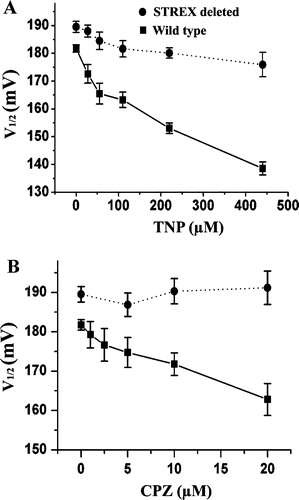
Figure 6. Effect of TNP (A) and CPZ (B) on the half activation voltage (V1/2) shift of the SAKCa and its STREX deleted channel. Estimates of the V1/2 value for a given condition represent the mean value for a set of at least three individual patches.