Figures & data
Figure 1. Alignment of the amino-acid sequences of kinetoplastid glycosomal ABC transporters. Sequences of putative Leishmania major (Lm) and Trypanosoma cruzi (Tc) orthologues were found by homology searches in the GeneDB database, using the T. brucei (Tb) sequence as a query. LmGAT1 (GeneDB systematic name LmjF31.0540), LmGAT2 (LmjF33.1860), LmGAT3 (LmjF27.0470), TcGAT1 (Tc00.1047053509237.30), TcGAT2 (Tc00.1047053510431.150) and TcGAT3 (Tc00.1047053506925.530). The sequences were aligned using the ClustalW 1.8 program (http://searchlauncher.bcm.tmc.edu/multi-align/Options/clustalw.html). Identical amino acids are given against a black background, conserved residues (similar in more than 50% of the sequences) against grey shading. Hatched bars above the alignment represent approximate positions of predicted TMSs as identified in GAT1 and GAT2 sequences using prediction programs available on the ExPASy server (http://www.expasy.org): TMHMM, HMMTOP and TopPred. Amino acids in bold-italic correspond to the region essential for targeting as revealed by deletion analysis (see text). The conserved RVVGLL motif identified in these regions is underlined. Boxed regions represent positions of the predicted PEX19-binding sites identified using the S. cerevisiae prediction matrix developed by Rottensteiner et al. Citation[46]. Asterisks indicate the region suggested by Landgraf et al. Citation[41] to bear targeting determinants of HsALDP.
![Figure 1. Alignment of the amino-acid sequences of kinetoplastid glycosomal ABC transporters. Sequences of putative Leishmania major (Lm) and Trypanosoma cruzi (Tc) orthologues were found by homology searches in the GeneDB database, using the T. brucei (Tb) sequence as a query. LmGAT1 (GeneDB systematic name LmjF31.0540), LmGAT2 (LmjF33.1860), LmGAT3 (LmjF27.0470), TcGAT1 (Tc00.1047053509237.30), TcGAT2 (Tc00.1047053510431.150) and TcGAT3 (Tc00.1047053506925.530). The sequences were aligned using the ClustalW 1.8 program (http://searchlauncher.bcm.tmc.edu/multi-align/Options/clustalw.html). Identical amino acids are given against a black background, conserved residues (similar in more than 50% of the sequences) against grey shading. Hatched bars above the alignment represent approximate positions of predicted TMSs as identified in GAT1 and GAT2 sequences using prediction programs available on the ExPASy server (http://www.expasy.org): TMHMM, HMMTOP and TopPred. Amino acids in bold-italic correspond to the region essential for targeting as revealed by deletion analysis (see text). The conserved RVVGLL motif identified in these regions is underlined. Boxed regions represent positions of the predicted PEX19-binding sites identified using the S. cerevisiae prediction matrix developed by Rottensteiner et al. Citation[46]. Asterisks indicate the region suggested by Landgraf et al. Citation[41] to bear targeting determinants of HsALDP.](/cms/asset/6e25077e-0b8a-490a-b7f1-9d1d5ba42a76/imbc_a_145995_f0001_b.gif)
Figure 2. Subcellular localization of GAT1, GAT2, and GAT3 variants. Procyclic trypanosomes were stably transfected with chromosomally-integrated plasmids designed for inducible expression of GFP-fusion proteins. After overnight induction, cells were processed for immunofluorescence with a polyclonal anti-hexokinase antibody as glycosomal marker. Full-length GAT1, full-length GAT3, full-length GAT2, GAT2(1–270) and GAT2(1–126) showed a punctuate fluorescence staining pattern completely colocalizing with hexokinase and clearly different from the pattern observed for GFP alone. GAT1(1–132) is mislocalized to the cytoplasm. In trypanosomes transfected with GAT2(1–270) only one or two enlarged glycosomes or aggregates of the organelles per trypanosome could be seen. The resolution did not permit an unambiguous distinction between these two possibilities, but aggregation seems most likely. Organelle aggregation has previously been described for the filamentous fungus Podospora anserina when its peroxisomal ABC transporter was overexpressed Citation[55]. Bars, 5 µm.
![Figure 2. Subcellular localization of GAT1, GAT2, and GAT3 variants. Procyclic trypanosomes were stably transfected with chromosomally-integrated plasmids designed for inducible expression of GFP-fusion proteins. After overnight induction, cells were processed for immunofluorescence with a polyclonal anti-hexokinase antibody as glycosomal marker. Full-length GAT1, full-length GAT3, full-length GAT2, GAT2(1–270) and GAT2(1–126) showed a punctuate fluorescence staining pattern completely colocalizing with hexokinase and clearly different from the pattern observed for GFP alone. GAT1(1–132) is mislocalized to the cytoplasm. In trypanosomes transfected with GAT2(1–270) only one or two enlarged glycosomes or aggregates of the organelles per trypanosome could be seen. The resolution did not permit an unambiguous distinction between these two possibilities, but aggregation seems most likely. Organelle aggregation has previously been described for the filamentous fungus Podospora anserina when its peroxisomal ABC transporter was overexpressed Citation[55]. Bars, 5 µm.](/cms/asset/9de92341-9db2-4f00-b3a8-c86b7edb307c/imbc_a_145995_f0002_b.jpg)
Figure 3. Schematic representation of T. brucei deletion mutant constructs and their glycosomal localization. The ellipse indicates the position of the GFP and the black boxes represent the positions of the predicted transmembrane segments. The subcellular localization as concluded from fluorescence is indicated as follows:+complete glycosomal localization;±partial glycosomal localisation; Cytopl. Cytoplasmic localization;-absence of detectable fluorescence.
Figure 4. Alignment of kinetoplastid putative PEX19s with human and yeast homologues. TbPEX19 (GeneDB systematic name Tb09.211.3300), LmPEX19 (LmjF35.3260) and TcPEX19 (Tc00.1047053510737.100) were identified in the GeneDB database by homology searches with human and yeast sequences. Identical amino acids are given against a black background, conserved residues (similar in more than 50% of the sequences) against grey shading.
Figure 5. Intracellular localization of TbPEX19 in mouse fibroblasts. Mouse fibroblasts transfected transiently with plasmids expressing the peroxisomal marker protein DsRed-SKL and GFP-TbPEX19 were examined for direct fluorescence 48 h after transfection. The two extreme observed phenotypes are presented. (A) TbPEX19 is found exclusively in the cytoplasm. (B) TbPEX19 is partially cytoplasmic and partially peroxisomal as shown by its colocalization with DsRed-SKL. Bars, 10 µm.
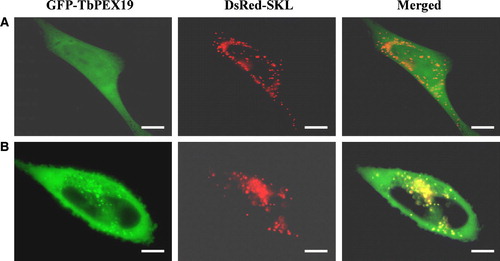
Table I. Binding properties of GAT1 and GAT2 fragments to human and trypanosomal PEX19s
Figure 6. Schematic representation of the binding capacity of human PEX19 variants containing random peptide insertions to TbGAT2(68–126), as observed using a bacterial two-hybrid system. The amino-acid sequence of human PEX19 is shown. The pentapeptide insertions are indicated by vertical arrows, and named by the position number of the amino-acid residue to the N-terminal side of the insertion followed by the sequence of the insertion. Pentapeptide insertions retaining the same binding properties as wild-type PEX19 are indicated with normal characters. Insertions resulting in a strongly diminished binding affinity for GAT2(68–126) are given in italic and are marked with a dot. Insertions that resulted in a diminished binding affinity for GAT2(68–126) but retained a strong affinity for the human membrane peroxins HsPEX11β, HsPEX16 and HsPEX26 Citation[38] are in normal characters and marked by underlining. Boxed, grey-shaded regions indicate α-helices as predicted by the PSA-server (probability R0.85).
![Figure 6. Schematic representation of the binding capacity of human PEX19 variants containing random peptide insertions to TbGAT2(68–126), as observed using a bacterial two-hybrid system. The amino-acid sequence of human PEX19 is shown. The pentapeptide insertions are indicated by vertical arrows, and named by the position number of the amino-acid residue to the N-terminal side of the insertion followed by the sequence of the insertion. Pentapeptide insertions retaining the same binding properties as wild-type PEX19 are indicated with normal characters. Insertions resulting in a strongly diminished binding affinity for GAT2(68–126) are given in italic and are marked with a dot. Insertions that resulted in a diminished binding affinity for GAT2(68–126) but retained a strong affinity for the human membrane peroxins HsPEX11β, HsPEX16 and HsPEX26 Citation[38] are in normal characters and marked by underlining. Boxed, grey-shaded regions indicate α-helices as predicted by the PSA-server (probability R0.85).](/cms/asset/82b37389-93a4-4e0e-b72e-a2ced6386c40/imbc_a_145995_f0006_b.gif)
Figure 7. Intracellular localization of GAT2(1–126) and GAT2(1–90) in CHO cells. CHO cells transfected transiently with plasmids expressing the peroxisomal marker protein DsRed-SKL and GFP-GAT2(1–126) or GFP-GAT2(1–90) were examined for direct fluorescence 48 h after transfection. In both cases the peroxisomal localization was demonstrated by the perfect colocalization with DsRed-SKL. Bars, 10 µm.
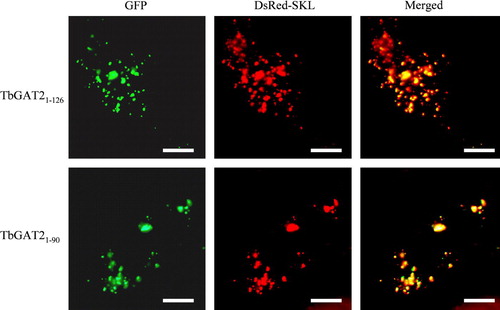
Figure 1s. Dendrogram showing the relationships between amino-acid sequences of described and putative peroxisomal ABC transporters. The tree was created using the ClustalX program. Positions with gaps were excluded and the tree was corrected for multiple substitutions. The closest related ABC transporter sequence of Escherichia coli was used to root the tree. Drosophila melanogaster, Caenorhabditis elegans, Yarrowia lipolytica, Neurospora crassa and Candida albicans sequences were the highest scoring hits obtained when the three GAT sequences were used in a BLAST search against the nr database at the NCBI website (http://www.ncbi.nlm.nih.gov). Numbers at the nodes represent the support for each node as obtained by 1000 bootstrap samplings. The horizontal bar represents 20 accepted amino-acid changes/100 residues.
Figure 9. Importance of TMS2 for glycosome-targeting efficiency. GAT1 and GAT2 constructs with similar deletions as inferred from sequence alignment were expressed in procyclic trypanosomes. The cells were processed for immunofluorescence with anti-hexokinase polyclonal antibody. The punctuate fluorescence pattern typical of glycosomal localization was only observed for the GAT2(Δ91–203) deletion construct. Bars, 5 µm.
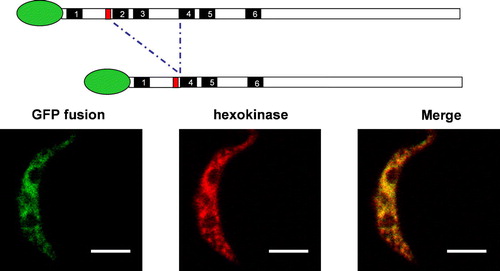
Table Is. Mapping of the TbGAT2 and HsPEX3 binding domain of TbPEX19