Figures & data
Figure 1. Schematic diagram of the temporal progression (from time zero (i) to less than one second (ii) to tens of seconds (iii)) of aggregation of suspended cells in a single pressure node half-wavelength ultrasound trap. Reproduced with permission from Citation[17]. This Figure is reproduced in colour in Molecular Membrane Biology online.
![Figure 1. Schematic diagram of the temporal progression (from time zero (i) to less than one second (ii) to tens of seconds (iii)) of aggregation of suspended cells in a single pressure node half-wavelength ultrasound trap. Reproduced with permission from Citation[17]. This Figure is reproduced in colour in Molecular Membrane Biology online.](/cms/asset/96cf7c0f-a841-41e7-99a8-6cf14b0f0ca9/imbc_a_155573_f0001_b.jpg)
Figure 2. (a) Schematic diagram of the cylindrical steel trap assembly, epi-microscope, sample loading and ultrasound generation. Its main components were a 1.5 MHz disc transducer attached to a steel acoustic coupling layer, a sample volume and a glass acoustic reflector. (b) Back view of the trap assembly.
Figure 3. Development of a 2-D chondrocyte aggregate: (a) 10 s, (b) 20 s, (c) 30 s, (d) 1 min, (e) 2 min, (f) 3 min, (g) 4 min and (h) 5 min after ultrasound initiation. Scale bar is 100 µm. The few voids of the aggregate are shown with arrows in (h), while the hexagonal order of the aggregate is depicted in the zoom-in image shown on the top right-hand part of (h). This Figure is reproduced in colour in Molecular Membrane Biology online.
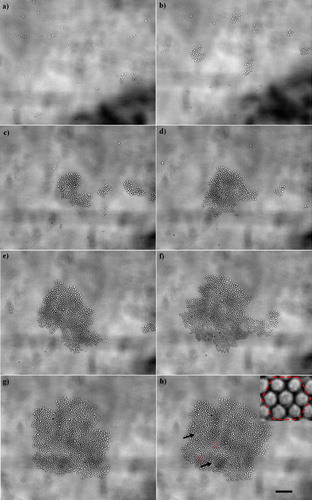
Figure 4. Distribution of (a) Cx43 and (b) F-actin in non-sonicated chondrocytes 1 h after their preparation. Cx43 (a) appeared highly granulated at the cytoplasm of the cells (arrows), while F-actin (b) consisted of an intricate network (arrows). Scale bar is 10 µm.
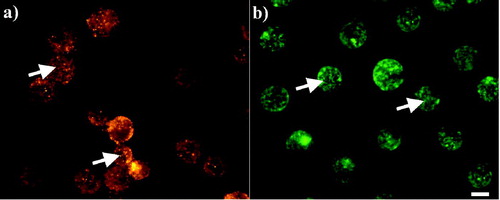
Figure 5. Distribution of peripheral (a) and interfacial (d) Cx43, and short (b) and long (e) interfacial F-actin in aggregates isolated from the trap after 1 (a, b) and 60 (d, e) min of ultrasound exposure respectively: (c, f) superimposed images. (g, h) distribution of Cx43 (intense cytoplasmic Cx43 pool, g) and F-actin (accumulation at the cell-cell interface, h) respectively in chondrocytes pre-incubated with 10 µg/ml CHX and levitated for 1 h in the trap. The superimposed image of g, h is shown in i. Scale bar is 10 µm.
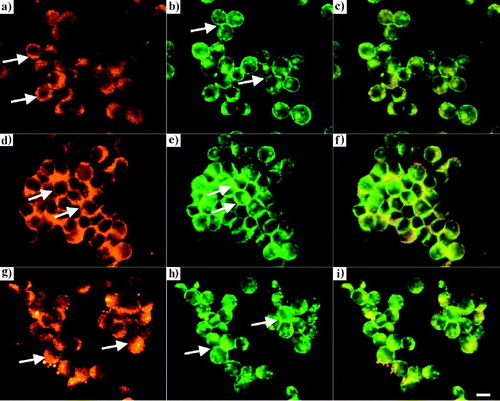
Figure 6. Measurements of the integral intensity of F-actin and Cx43 in control and cycloheximide (10 µg/ml CHX) -pretreated cells, at the cell-cell interface of 20 randomly selected pairs of cells (10 randomly selected pairs of cells from each of two replicate experiments.) The error bars represent one standard error of the mean. This Figure is reproduced in colour in Molecular Membrane Biology online.
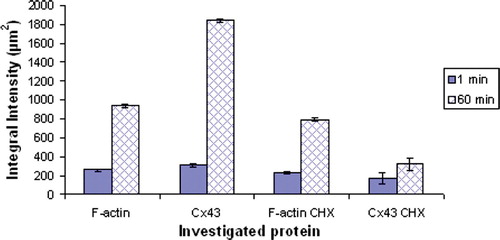
Figure 7. RT-PCR analysis of Cx43 gene expression in immature bovine articular cartilage. cDNA was prepared from cartilage removed from the surface and deep zones of the joint and subjected to PCR using primers specific for housekeeping gene GAPDH (501 bp) and Cx43 (327 bp). The results are representative amplifications from experiments using explants taken from 3 different donors.
Table I. Counts of labeled cells present in a randomly selected field of view in the presence and absence of the gap junctional blocker 1-octanol over time.