Figures & data
Figure 1. DC2.4 cells activation by cationic liposome stimulation. (A) Expression of co-stimulatory molecule CD80 on DC2.4 cells after incubation with DOTAP of different concentration or with LPD (contains 75 µM of DOTAP). Experiments were performed in triplicates and the data reported as mean±SD (n=3). (B) Expression of co-stimulatory molecules, CD80 and CD86 on DC2.4 cells after stimulation with different cationic liposomes.
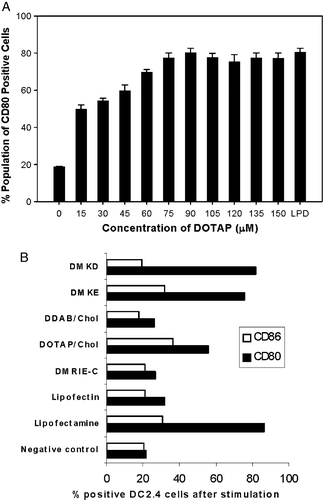
Figure 2. Influence of lipid head group on the expression of CD80 on DC2.4 cells or bone marrow derived dendritic cells. DC2.4 cells were stimulated by liposomes with different charged head groups (A) or counter ions (B) and CD80 expression on DC2.4 was measured by flow cytometry as described. The concentration of each liposomal formulation was 75 µM. LPD is the positive control. Untreated cells stained with FITC anti-CD80 were used as negative control. Experiments were done in triplicates and the data shown as the mean±SD. (C) Expression of co-stimulatory molecule CD80 on bone marrow derived primary dendritic cells upon incubation with various liposomal formulations. The concentration of each formulation was 75 µM. DCs were stained with anti-CD11c and anti-CD80 antibodies. Untreated cells were used as negative control (thin lines) and LPS treated cells (1 µg/ml) was used as positive control. Solid line represents the treated samples where as the shaded region represents the isotype control.
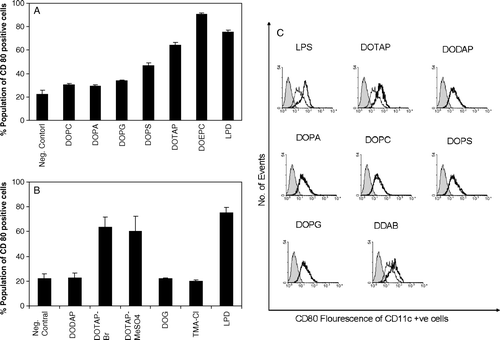
Figure 3. Effect of hydrocarbon chain lengths of cationic lipids on the expression of CD80 on DC2.4 cells or bone marrow derived dendritic cells. (A) DC2.4 cells were stimulated by liposomes with variant hydrocarbon chain lengths and CD80 expression was measured by flow cytometry. Data reported are the mean±SD (n=3). Concentration of the liposomes used was 75 µM. (B and C) Bone marrow derived mouse primary dendritic cells were incubated with liposomes with variant hydrocarbon chain lengths and CD80 expression was measured by flow cytometry. The concentration of each formulation was 75 µM. DCs were stained with anti-CD11c and anti-CD80 antibodies. Untreated cells were used as negative control (thin lines). Solid line represents the treated samples where as the shaded region represents the isotype control.
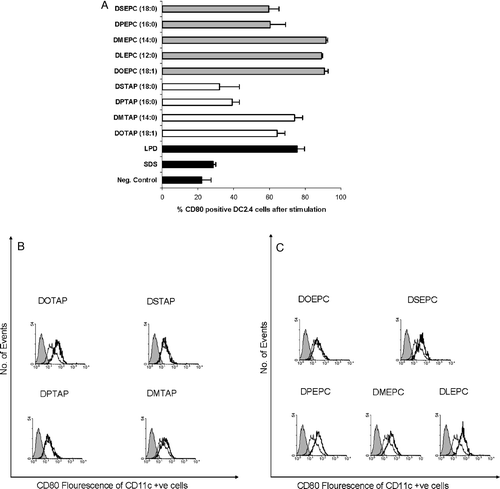
Figure 4. Influence of the fusogenic lipid on the expression of CD80 by cationic lipids on DC2.4 cells. (A) Cationic lipid concentration was used as 75 µM in all the formulations and the fusogenic lipid, DOPE was added in a 1:1 molar ratio. Untreated, FITC anti-CD80 stained cells were used as negative control. (B) DC2.4 cells were treated with DOEPC in either aqueous solution or in DMSO. Untreated and DMSO treated DC2.4 cells were used as controls. Data are presented as mean±SD (n=3).
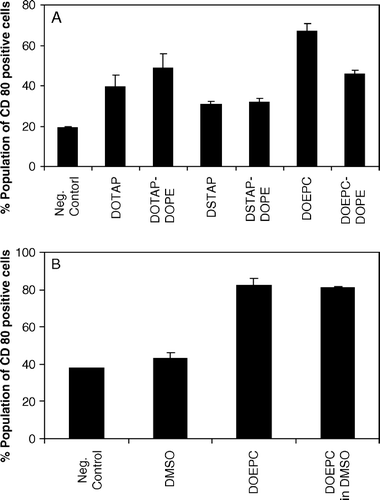
Figure 5. TNF-α release from DC2.4 cells upon 3 h incubation with different cationic lipids or lipopolysaccharide. The concentration of each of the lipid formulation was 75 µM. LPS was used at a concentration of 0.5 µg/ml. The data represented as mean±SD (n=3) of one representative experiment.
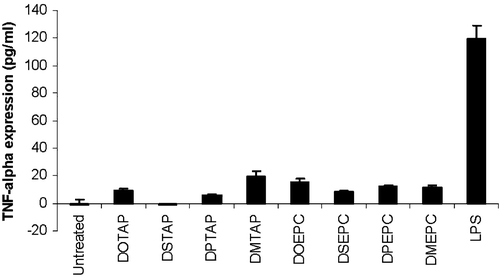
Figure 6. Inhibition of the LPS-induced TNF-α expression from DC2.4 cells by (a) DOTAP with the absence (w/o) or presence (w) of 10% serum or by (b) other different cationic lipids. The concentration of the lipid formulation was 75 µM. LPS was used at a concentration of 0.5 µg/ml. The data reported are mean±SD (n=3). For the inhibition experiments the cationic lipids were incubated with serum for 30 min before the addition of LPS.
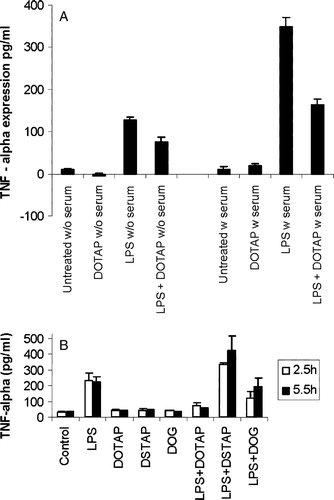
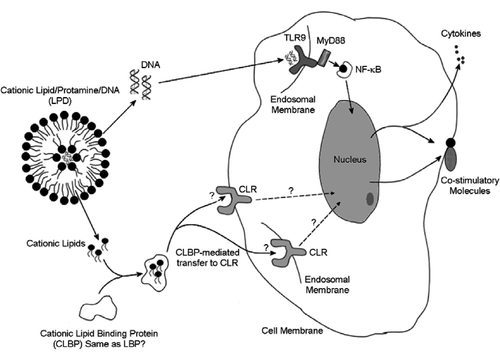
Figure 7. Schematic representation of the postulated model for the stimulation of dendritic cells by cationic liposome and by LPD.