Figures & data
Supplementary Table I. Primers used for the generation of site-directed mutations in MCT1 and basigin. For site-directed mutations the underlined bases represent the change in nucleotide sequence introduced to provide the necessary mutation.
Figure 1. Homology model of rat MCT1 based on the E. coli glycerol 3-phosphate transporter (1PW4) template. The ribbon is coloured from red to purple along the sequence according to the horizontal bar (N to C). The numbered residues refer to those discussed in the text. Acidic residues (Asp, Glu) are represented by red spheres at the C-alpha position, basic residues (Arg, Lys) by blue spheres, histidine by pink spheres and aromatic residues frequently found at the phospholipid interface (Tyr, Trp) in yellow. Phe306, that is known to be in the substrate-binding pocket, is shown in brown. The black vertical bar measures 30 Å and marks the ‘best guess’ position of the lipid bilayer. The sequence alignment of rat MCT1 with the E. coli glycerol 3-phosphate transporter used to generate the model is shown beneath the model. Lower case letters refer to residues not built in the model and residues not present in the 1PW4 crystal structure respectively. Sequence in red refers to TM-helices in the template and predicted by TMHMM in the target sequence.
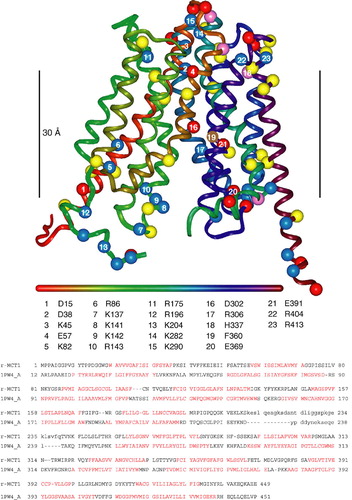
Figure 2. The E218Q mutant of basigin, but not the E218R mutant, supports lactate transport by MCT1 in Xenopus oocytes. In panel A, oocytes were injected with water (0), or cRNA for MCT1 (1) in the absence or presence (A) of antisense cRNA against Xenopus basigin and cRNA for rat basigin (B). Western blots are shown for the crude plasma membrane fraction using both MCT1 and basigin antibodies. In panel B rates of L-lactate (30 mM) transport into oocytes measured using BCECF fluorescence are shown as means±SEM of 5–8 separate oocytes. Where indicated, antisense (AS) against Xenopus basigin as well as the cRNA for WT-, E218Q- or E218R-basigin was co-injected with the MCT1 cRNA.
Figure 3. The E218Q mutant of basigin, but not the E218R mutant, is correctly targeted to the plasma membrane of COS cells. COS cells were co-transfected with MCT1-c-CFP and basigin-c-YFP constructs containing the mutations indicated and live cell imaging performed as described under ‘Methods’. This Figure is reproduced in colour in Molecular Membrane Biology online.
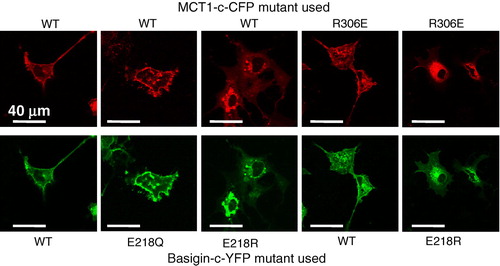
Figure 4. R306E-MCT1 and E218R-basigin are not expressed at the plasma membrane of Xenopus oocytes. Oocytes were micro-injected with the cRNA shown and after 72 hours some oocytes were used for immunofluorescence microscopy with the antibody shown (panel A) and others used for membrane preparation followed by SDS-PAGE (20 µg protein) and western blotting with anti-rat MCT1 antibody (panel B). For the western blot, kidney plasma membranes were used as a positive control. The faint band in the water-injected controls represents very slight sample contamination and is only visible because of the over-exposure of the blot to ensure any expressed MCT was detected. Further details are given under ‘Methods’. This Figure is reproduced in colour in Molecular Membrane Biology online.
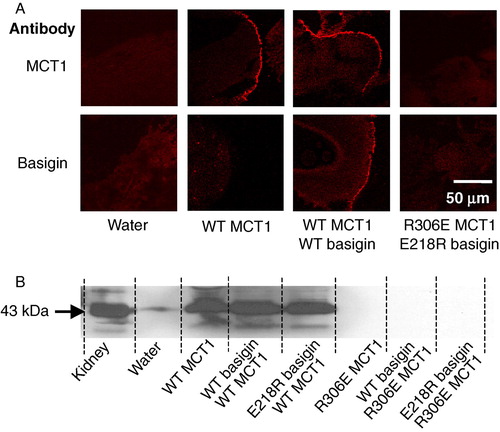
Table I. Summary of the expression and transport activity of wild-type and mutant MCT1 expressed in Xenopus laevis oocytes in the presence and absence of WT- and mutant basigin. Where given, Vmax and Km values (±SE) were determined from the initial rates of transport of L-lactate determined using BCECF fluorescence as described under Methods. Four oocytes were used in each case and L-lactate was added at 2.5, 5, 10, 20 and 40 mM. Data analysis was performed as described previously (Manning Fox et al. [Citation2000]). Where no transport could be detected using BCECF confirmation was made by determining the uptake of 0.5 mM L-[14C]-lactate at 10 min as described under Methods. Transport was indicated when uptake was significantly greater than in water injected oocytes, but in no case in which no BCECF response was detected was this observed. nd: not determined.
Figure 5. D302R/R306E- MCT1 is expressed at the plasma membrane of Xenopus oocytes but is inactive. Details are as given for . Transport measurements are not shown because D302R/R306E-MCT1 failed to elicit any lactate transport whether or not WT- or E218R-basigin cRNA was co-injected. This Figure is reproduced in colour in Molecular Membrane Biology online.
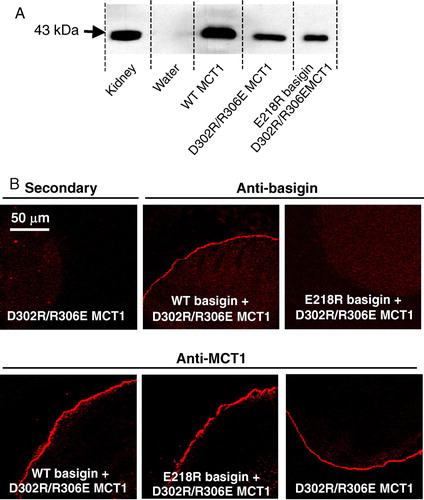
Figure 6. R306K-MCT1 is expressed at the plasma membrane of Xenopus oocytes but is inactive. Details are as given for . Transport measurements are not shown because R306K-MCT1 failed to elicit any lactate transport whether or not WT- or E218R-basigin cRNA was co-injected. This Figure is reproduced in colour in Molecular Membrane Biology online.
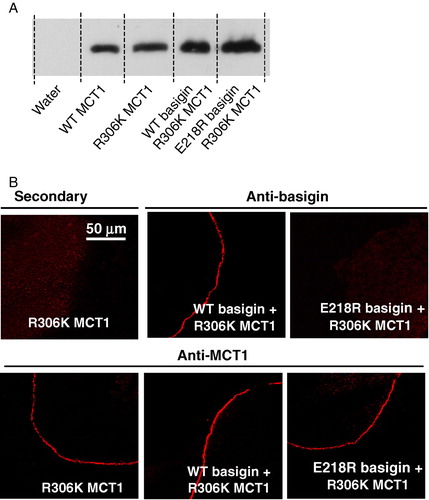
Figure 7. Mutation of Arg86 or Arg196 to glutamine or glutamate does not prevent MCT1 from being correctly targeted to the plasma membrane of COS cells. COS cells were co-transfected with MCT1-c-CFP and basigin-c-YFP constructs containing the mutations indicated and live cell imaging performed as described under ‘Methods’. This Figure is reproduced in colour in Molecular Membrane Biology online.
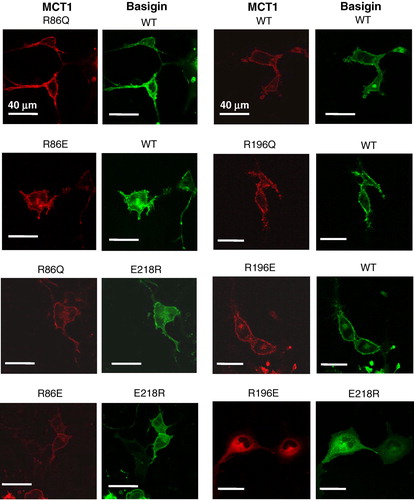
Figure 8. FRET measurements suggest that mutation of Arg86 perturbs the interaction of MCT1 with basigin. COS cells were co-transfected with MCT1-c-CFP and basigin-c-YFP constructs containing the mutations indicated and live cell imaging with determination of FRET performed as described under ‘Methods’. Data are presented as means±SEM for the number of observations shown.
Supplementary Table II. The effects of mutating charged residues in potential TM helices of MCT1 on its plasma membrane expression and activity. Data are summarized from previous work of others (Rahman et al. 1999, Galic et al. 2003) and the present studies.