Figures & data
Figure 1. (A) Structure of NalP, showing the N-terminal α-helix (blue) and the transmembrane β-barrel (green). (B) Snapshot of simulation system NalP1 showing the protein embedded in a DMPC bilayer with the phosphorus atoms in red. Water molecules have been omitted for clarity. (C) Snapshot of the system at the end of simulation NalP1.
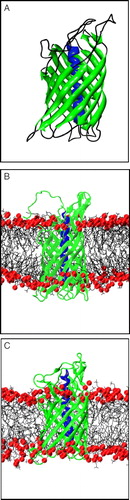
Table I. Summary of simulations.
Figure 2. Conformation drift of NalP, measured as Cα root mean square deviation (RMSD) from the starting structure. RMSDs vs. time are shown for simulations: (A) NalP1 and (B) NalP3.
Figure 3. Fluctuations (measured as the root mean square fluctuation, RMSF, of each Cα atom) as a function of residue number (where residue 1 of the simulation corresponds to residue 786 of the X-ray structure) for simulations NalP1 (black) and NalP3 (grey).
Figure 4. (A) Pore radius profiles for the barrel (with the helix removed before radius evaluation for simulation NalP1) of NalP, averaged over the duration of each simulation for NalP1 (black line, ‘intact’) and NalP3 (grey line, ‘no helix’). The horizontal broken line represents the radius of a water molecule. The vertical broken lines represent the approximate extent of the lipid bilayer. (B) Selected trajectories for individual waters along the z axis (i.e., the bilayer normal) for simulation NalP2. Three water molecules are seen to enter the pore region from the periplasmic side (z negative). The horizontal broken lines represent the extent of the lipid bilayer.
Figure 5. Water molecules (red/white) within the barrel of simulations. (A) NalP2 and (B) NalP3. In each case the figure corresponds to the final (10 ns) structure from the simulation. The water molecules are in red/white, the barrel in blue, and the helix in black.
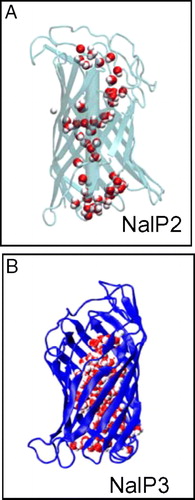
Figure 6. H-bonds within the pore. (A) The number of H-bonds vs. time for simulation NalP2, showing barrel-helix (pale grey), helix-water (dark grey), and barrel-water (black) H-bonds. (B) Barrel-water H-bonds vs. time for simulation NalP3.